Just like with everything else, tools won't give you good results unless you know how, when, and why to apply them. If you go out and you buy the most expensive frying pan on the market it's still not going to make you a good chef. - Christin Wiedemann
The Instruments app in Xcode provides a rich set of tools and templates for profiling your app performance that can help you debug and overcome performance issues, like bad CPU usage, poor implementation of battery resources, unnecessary memory consumption, etc.
If you are testing with the Instruments app and notice that the battery is draining fast, too much CPU is being used, etc., take a screenshot of the profiler and attach it to your task because this will help developers to find the issue much faster.
Although it's embedded within and may be used with Xcode, Instruments is a separate app, which may be used independently as needed.
To install Xcode, go to App Store and install it from there.
To start using Instruments and profile the app, an iOS developer will need to install a debug build on your device (preferable). There is another option with using any build which doesn't require a developer but has a constraint which is hidden names for all collected data.
The other option is good if you only need to check overall app performance without digging deep into the data.
How to setup everything is explained below on example of non-debug build.
Steps:
Connect an iPhone with Macbook and open the app you want to profile (this is important because it won't work if the app is closed).
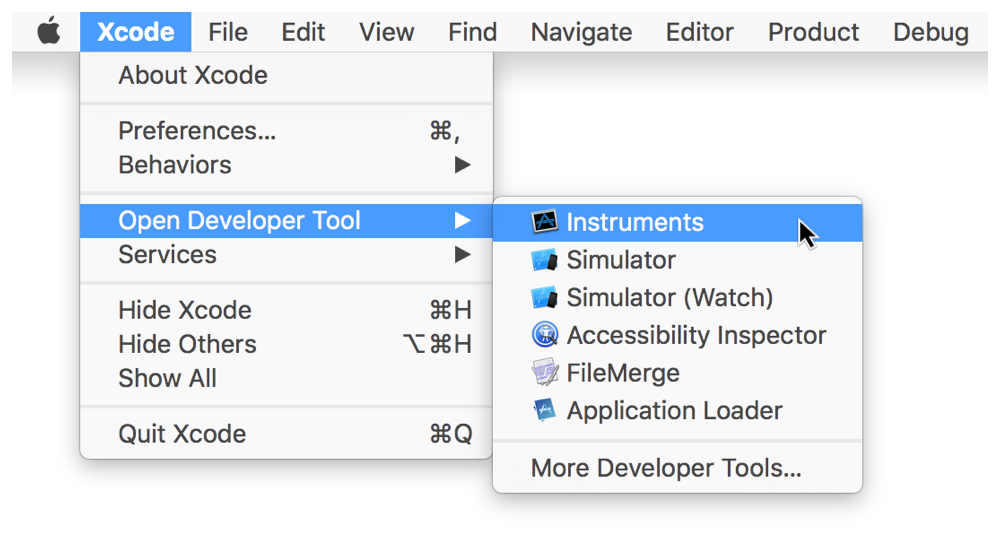
In Xcode, choose Xcode > Open Developer Tool > Instruments.
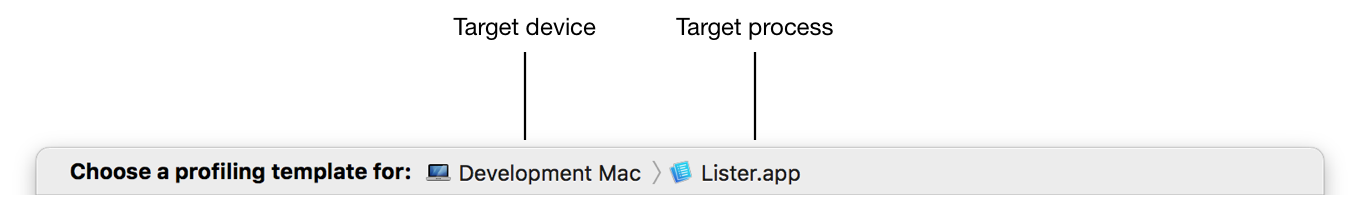
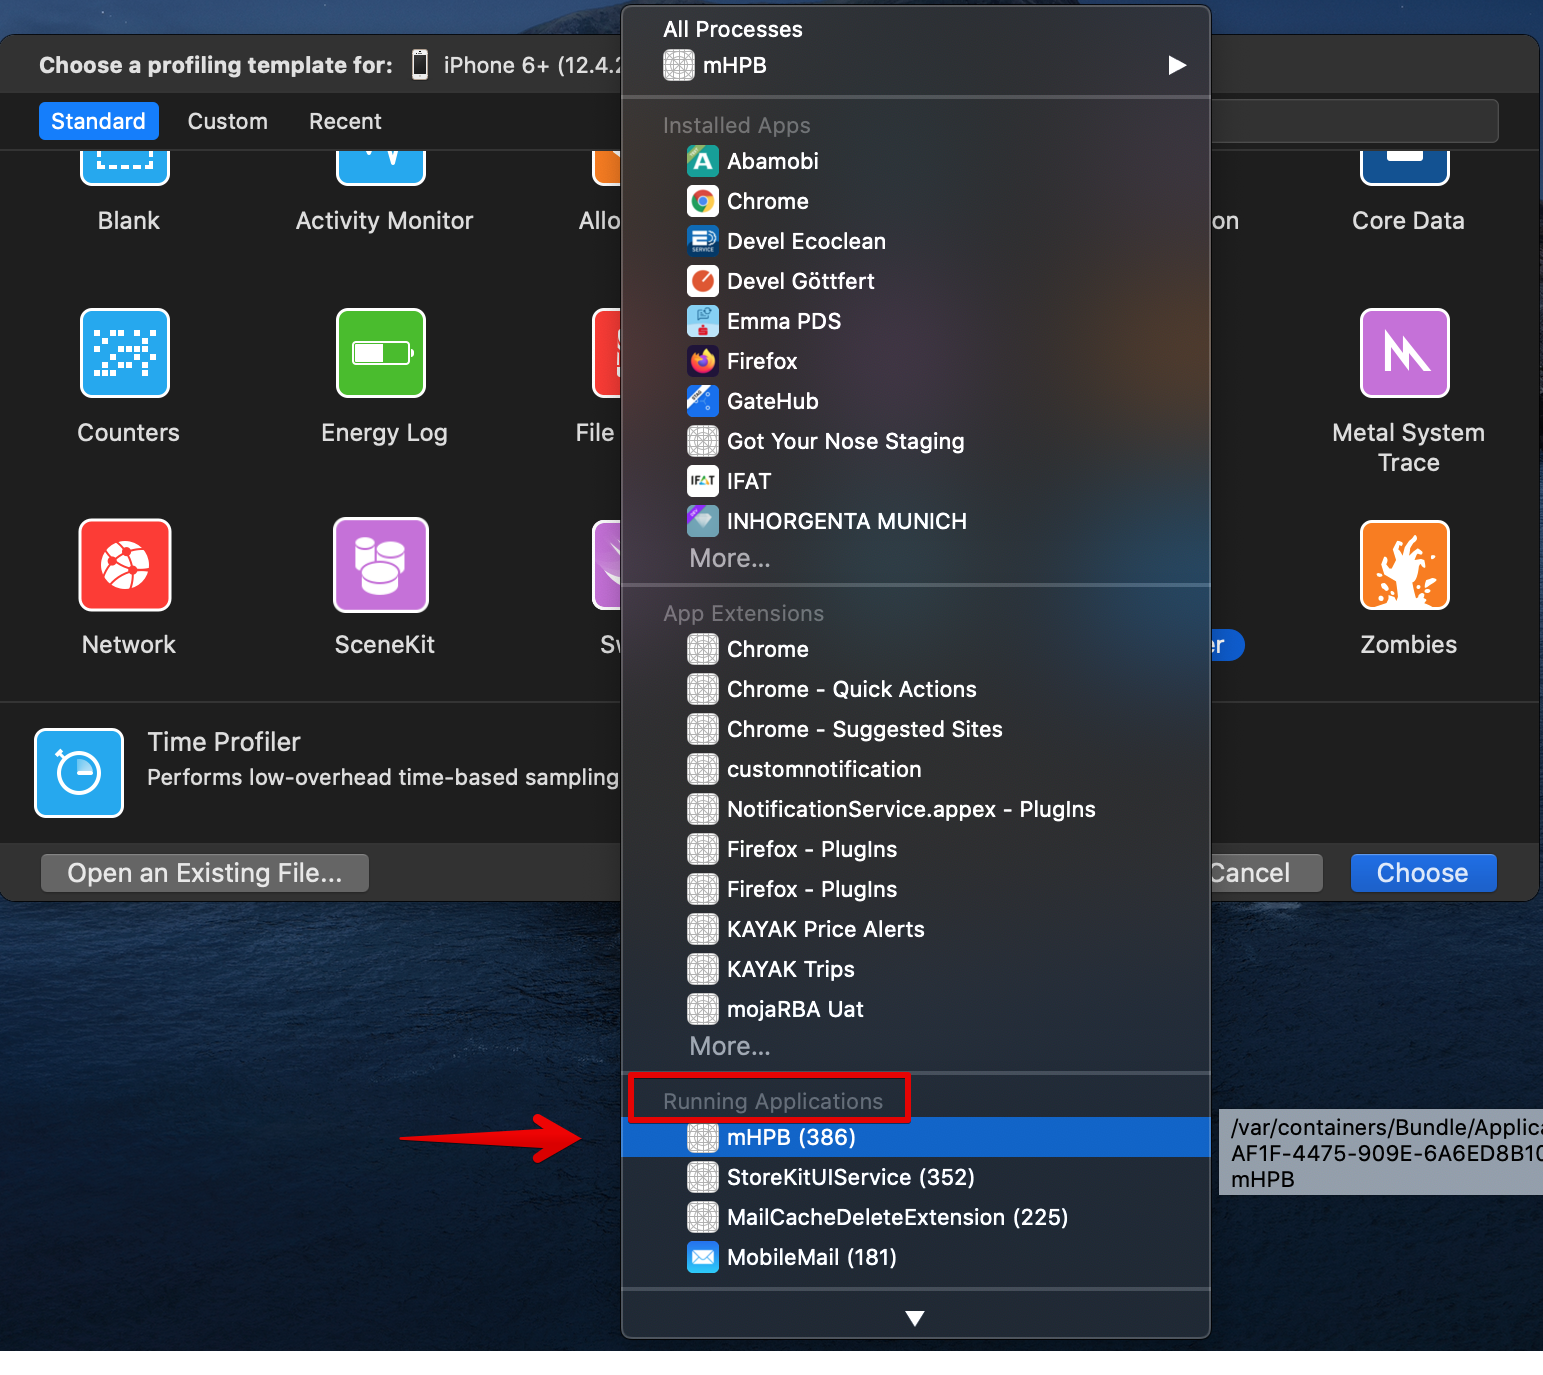
In the profiling template selection dialog that appears, select a target device and find your app in the Running Applications list.
Select a desired profiling template.
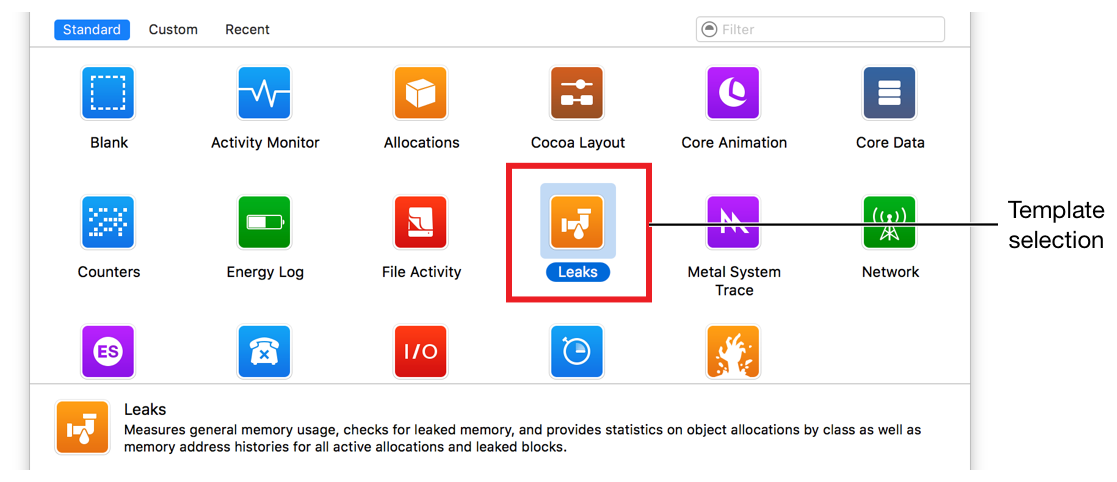
Click Choose.
Click the Record button in the toolbar (or press Command-R) to begin recording.
Use your app or the system normally.
Click the Stop button, or press Command-R again, when complete.
A trace document is used to organize and configure instruments for profiling, initiate data collection, and view and analyze the results.
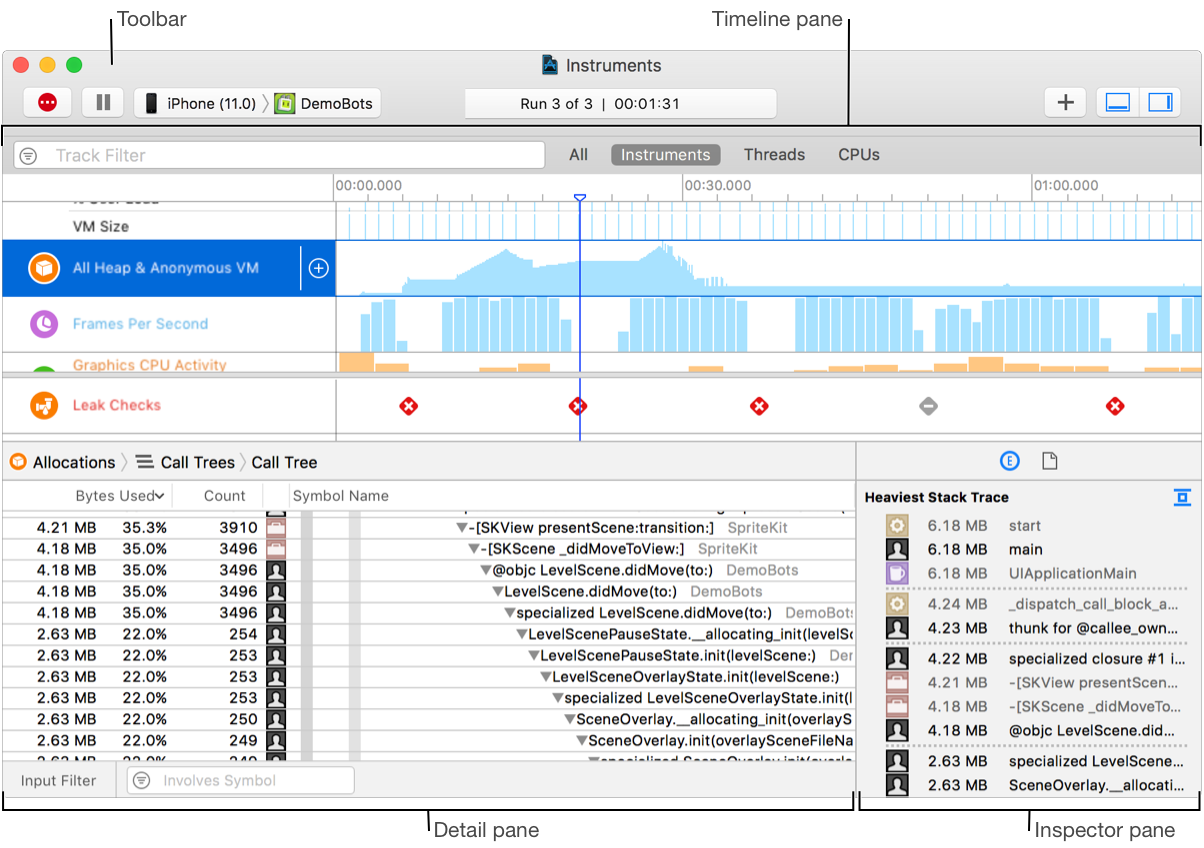
The trace document includes the following main areas:
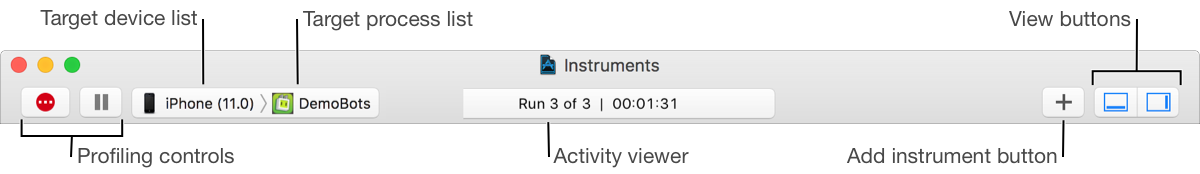
- Toolbar: Allows you to start, pause, and stop data profiling, add instruments, hide and show panes, and more.
- Profiling controls: Allow you to record, pause, and stop data collection.
- Target device list: Allows you to select the device on which you wish to profile.
- Target process list: Allows you to select the process or processes to profile.
- Activity viewer: Shows the number of runs for the trace document and the elapsed time of the current trace.
- Add Instrument button (+): Shows or hides the instruments Library palette, which contains a complete list of available instruments. From here, you can select individual instruments and add them to your trace document.
- View buttons (): Hide or show the detail pane and inspector.
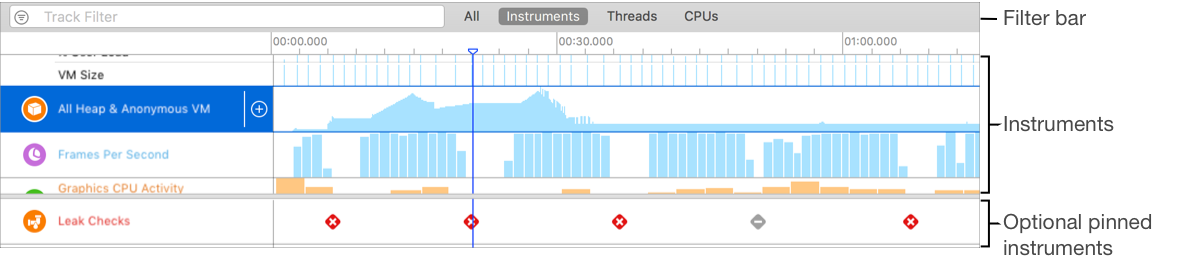
- Timeline pane: Displays a graphical summary of the data recorded for a given trace.
- This pane’s information is read-only, you can scroll through data, select specific areas for closer examination, and insert flags to highlight points of interest.
- Click the strategy buttons in the filter bar to display instruments, CPU core, thread data, or all three items in the timeline.
- CPUs: Displays a list of CPU cores, along with their usage over time, in the timeline pane. Only available when a trace document contains instruments that record CPU data.
- Instruments: Displays a list of instruments and their corresponding data in the timeline pane. If you select an instrument in the list, you can delete it or configure it in the inspector pane. The instruments list is visible by default when you create a trace document.
- Threads: Displays a list of threads and their utilization data in the timeline pane. Only available when a trace document contains instruments that record thread data.
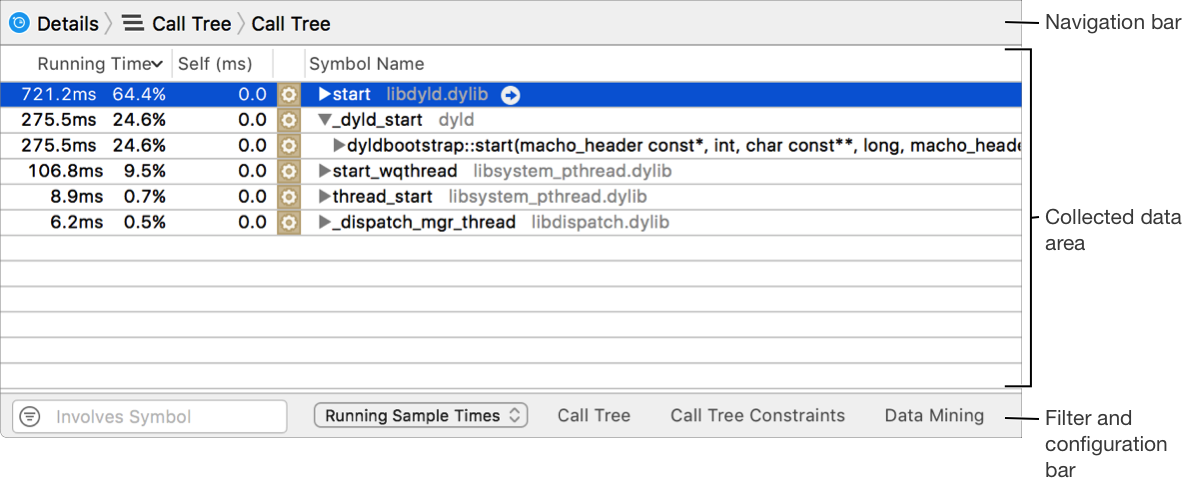
- Detail pane: Shows detailed information about the data collected by the instruments in your trace document.
- Navigation bar
- Instrument: Icon of the currently selected instrument in the timeline pane. Click this to view the console for the instrument.
- Detail type list: Allows you to navigate between different types of data. The options displayed here vary, depending on the actively selected instrument. For many instruments, the list includes things like a summary of data, a call tree, and a console.
- Detail tree: Keep track of where you are in the hierarchy as you navigate through the data in the detail pane. Click a branch of the tree to move back up the hierarchy to the corresponding data.
- Collected data area
- The collected data area shows you all of the data for the selected instrument, typically in tabular format. The content displayed here varies significantly from instrument to instrument. For example, the Activity Monitor instrument displays process, CPU, and thread information, and much more.
- Filter and configuration bar
- Filter field: Allows you to filter collected data for a specific term. Click the filter field’s menu for some additional filtering options. You can also filter collected data more extensively by adjusting display settings in the display configuration popover.
- Display configuration controls: Refine the displayed results by filtering, sorting, and data mining. The controls vary from instrument to instrument and can include menus for selecting different views of the results, and popovers for constraining the data that is shown.
- Navigation bar
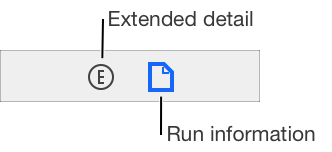
- Inspector pane: Contains summary information about the current data record and instrument specific extended detail.
- Run information area: The run information area shows information about the run displayed in the detail pane including the target, recording time, and the settings used for the recording.
- Extended detail area: The extended detail area is used to display additional instrument-specific information about selected data in the detail pane, such as a complete stack trace.
In the Instruments documentation you can find additional options this tool can give you like tracking CPU core and thread use, find performance bottlenecks and memory leaks, etc. You can even find zombies, I kid you not.