Only conducting performance testing at the conclusion of system or functional testing is like conducting a diagnostic blood test on a patient who is already dead. - Scott Barber
How to?
There are many reasons why an app is having performance issues, like bad CPU usage, unnecessary memory consumption, poor implementation of battery resources, etc.
To debug and overcome these issues you can use Android Profiler for Android apps.
If testing with this tool and you notice too much CPU is used, battery is draining fast, etc., take a screenshot of the profiler and attach it to your task because this will help developers to figure out the problem much faster.
Android Profiler
The Android Profiler tools provide real-time data to help you to understand how your app uses CPU, memory, network, and battery resources.
Profiling ("program profiling", "software profiling") is a form of dynamic program analysis that measures, for example, the space (memory) or time complexity of a program, the usage of particular instructions, or the frequency and duration of function calls.
You will need Android Studio for this, so make sure to download and install it.
To profile your app, it's recommended to have: - An app with a release build variant that has the profileable manifest configuration enabled, also known as a profileable app - A virtual or physical test device that runs API level 29 or higher and has Google Play - Android Gradle Plugin 7.3 or higher
There are two ways to start profiling:
- You will need debug APK file.
- You will need an access to the codebaase.
You want to have debug APK because it is much easier and faster solution. If there is no debug APK, ask developer to build one for you. They always work with debug APK and it's not time consuming or complex for them to do it for you.
Steps:
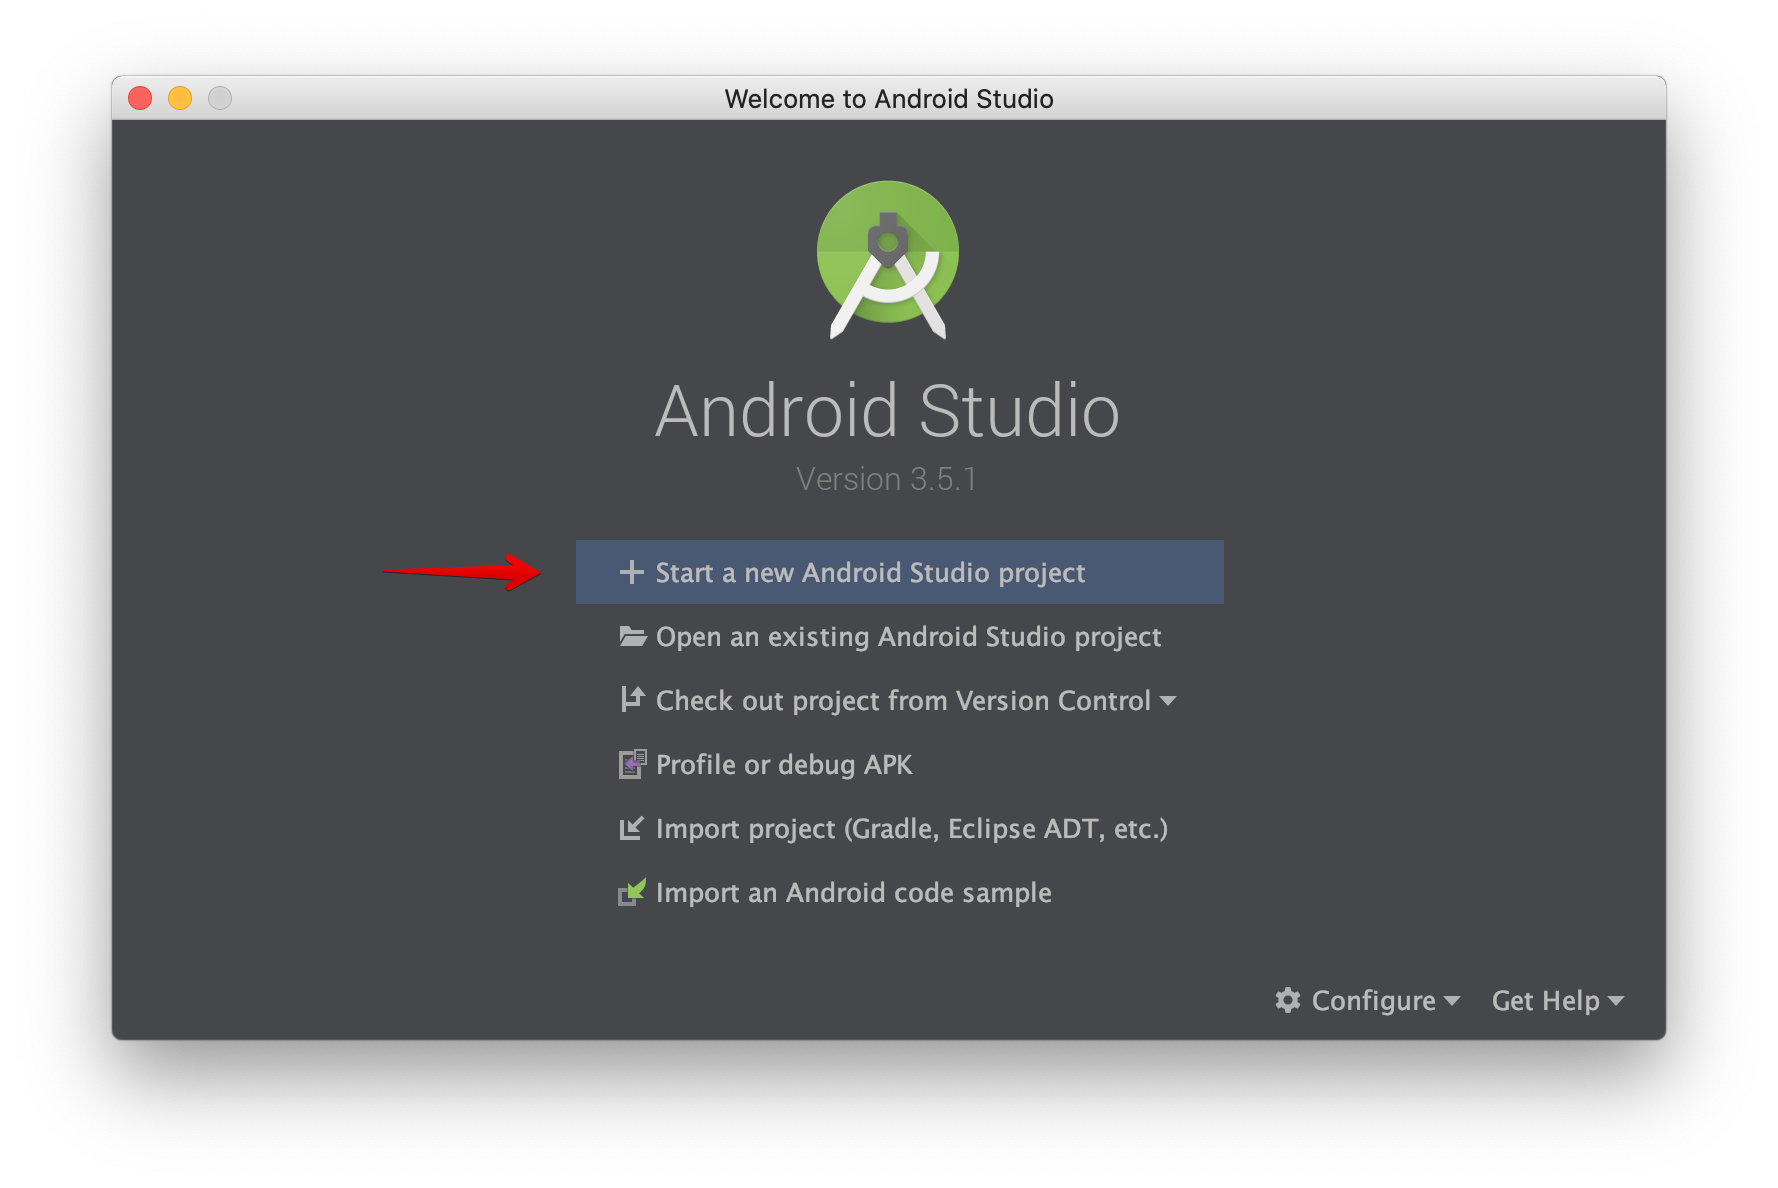
Open Android Studio.
Select "New Project".
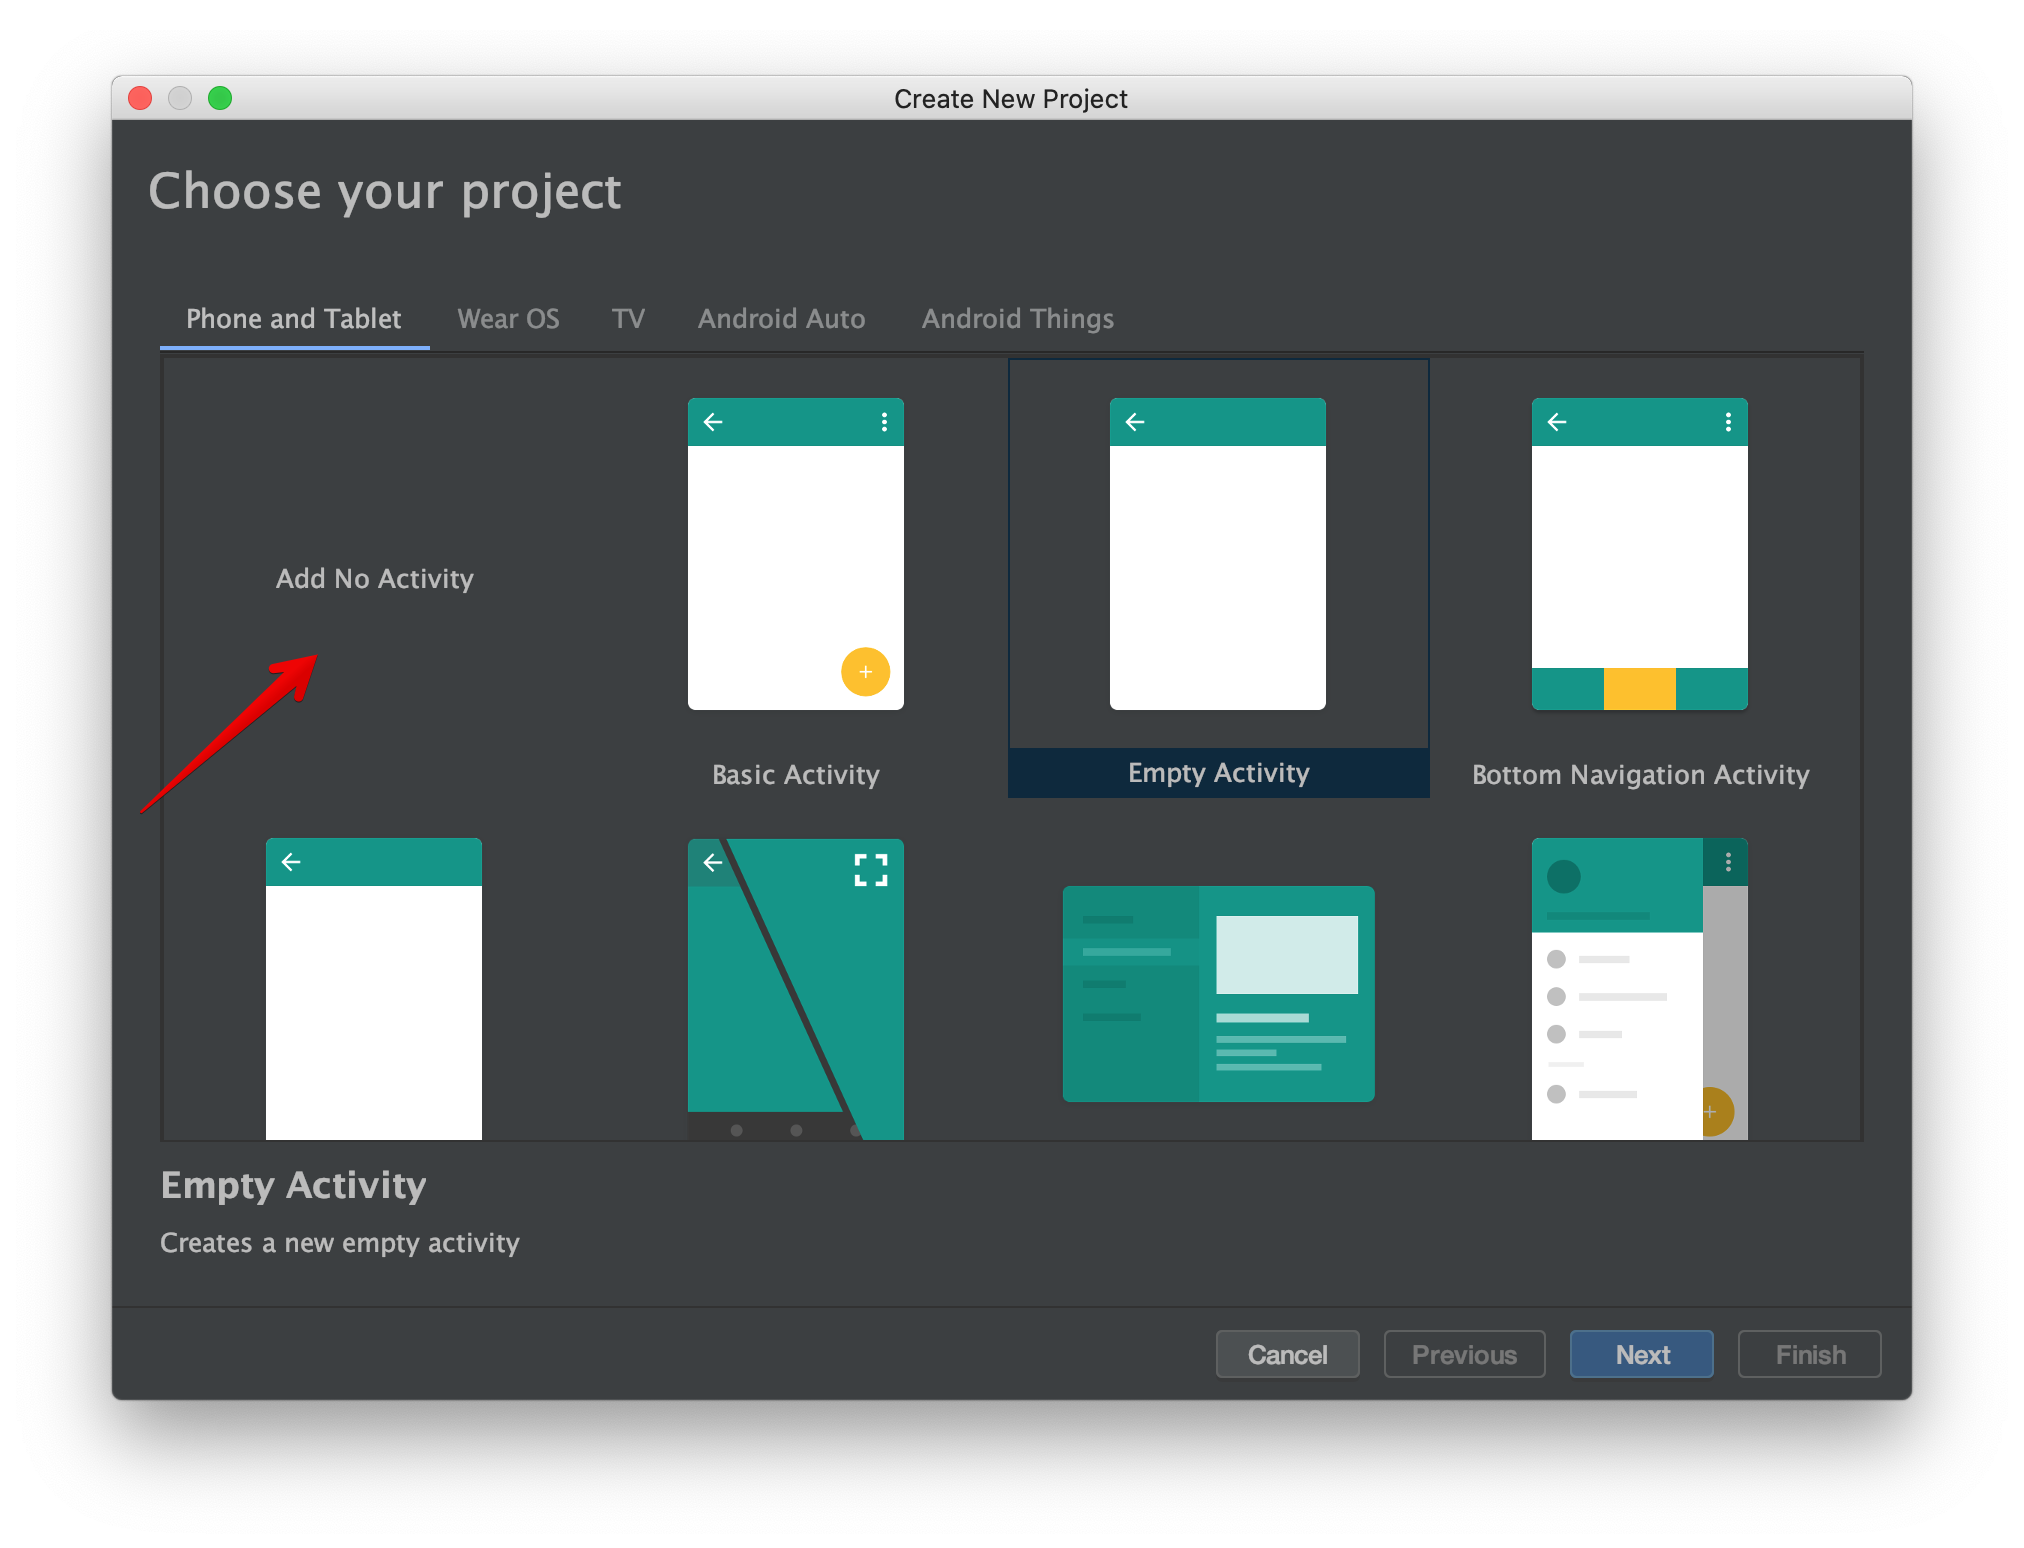
Select "No activity" and click Next.
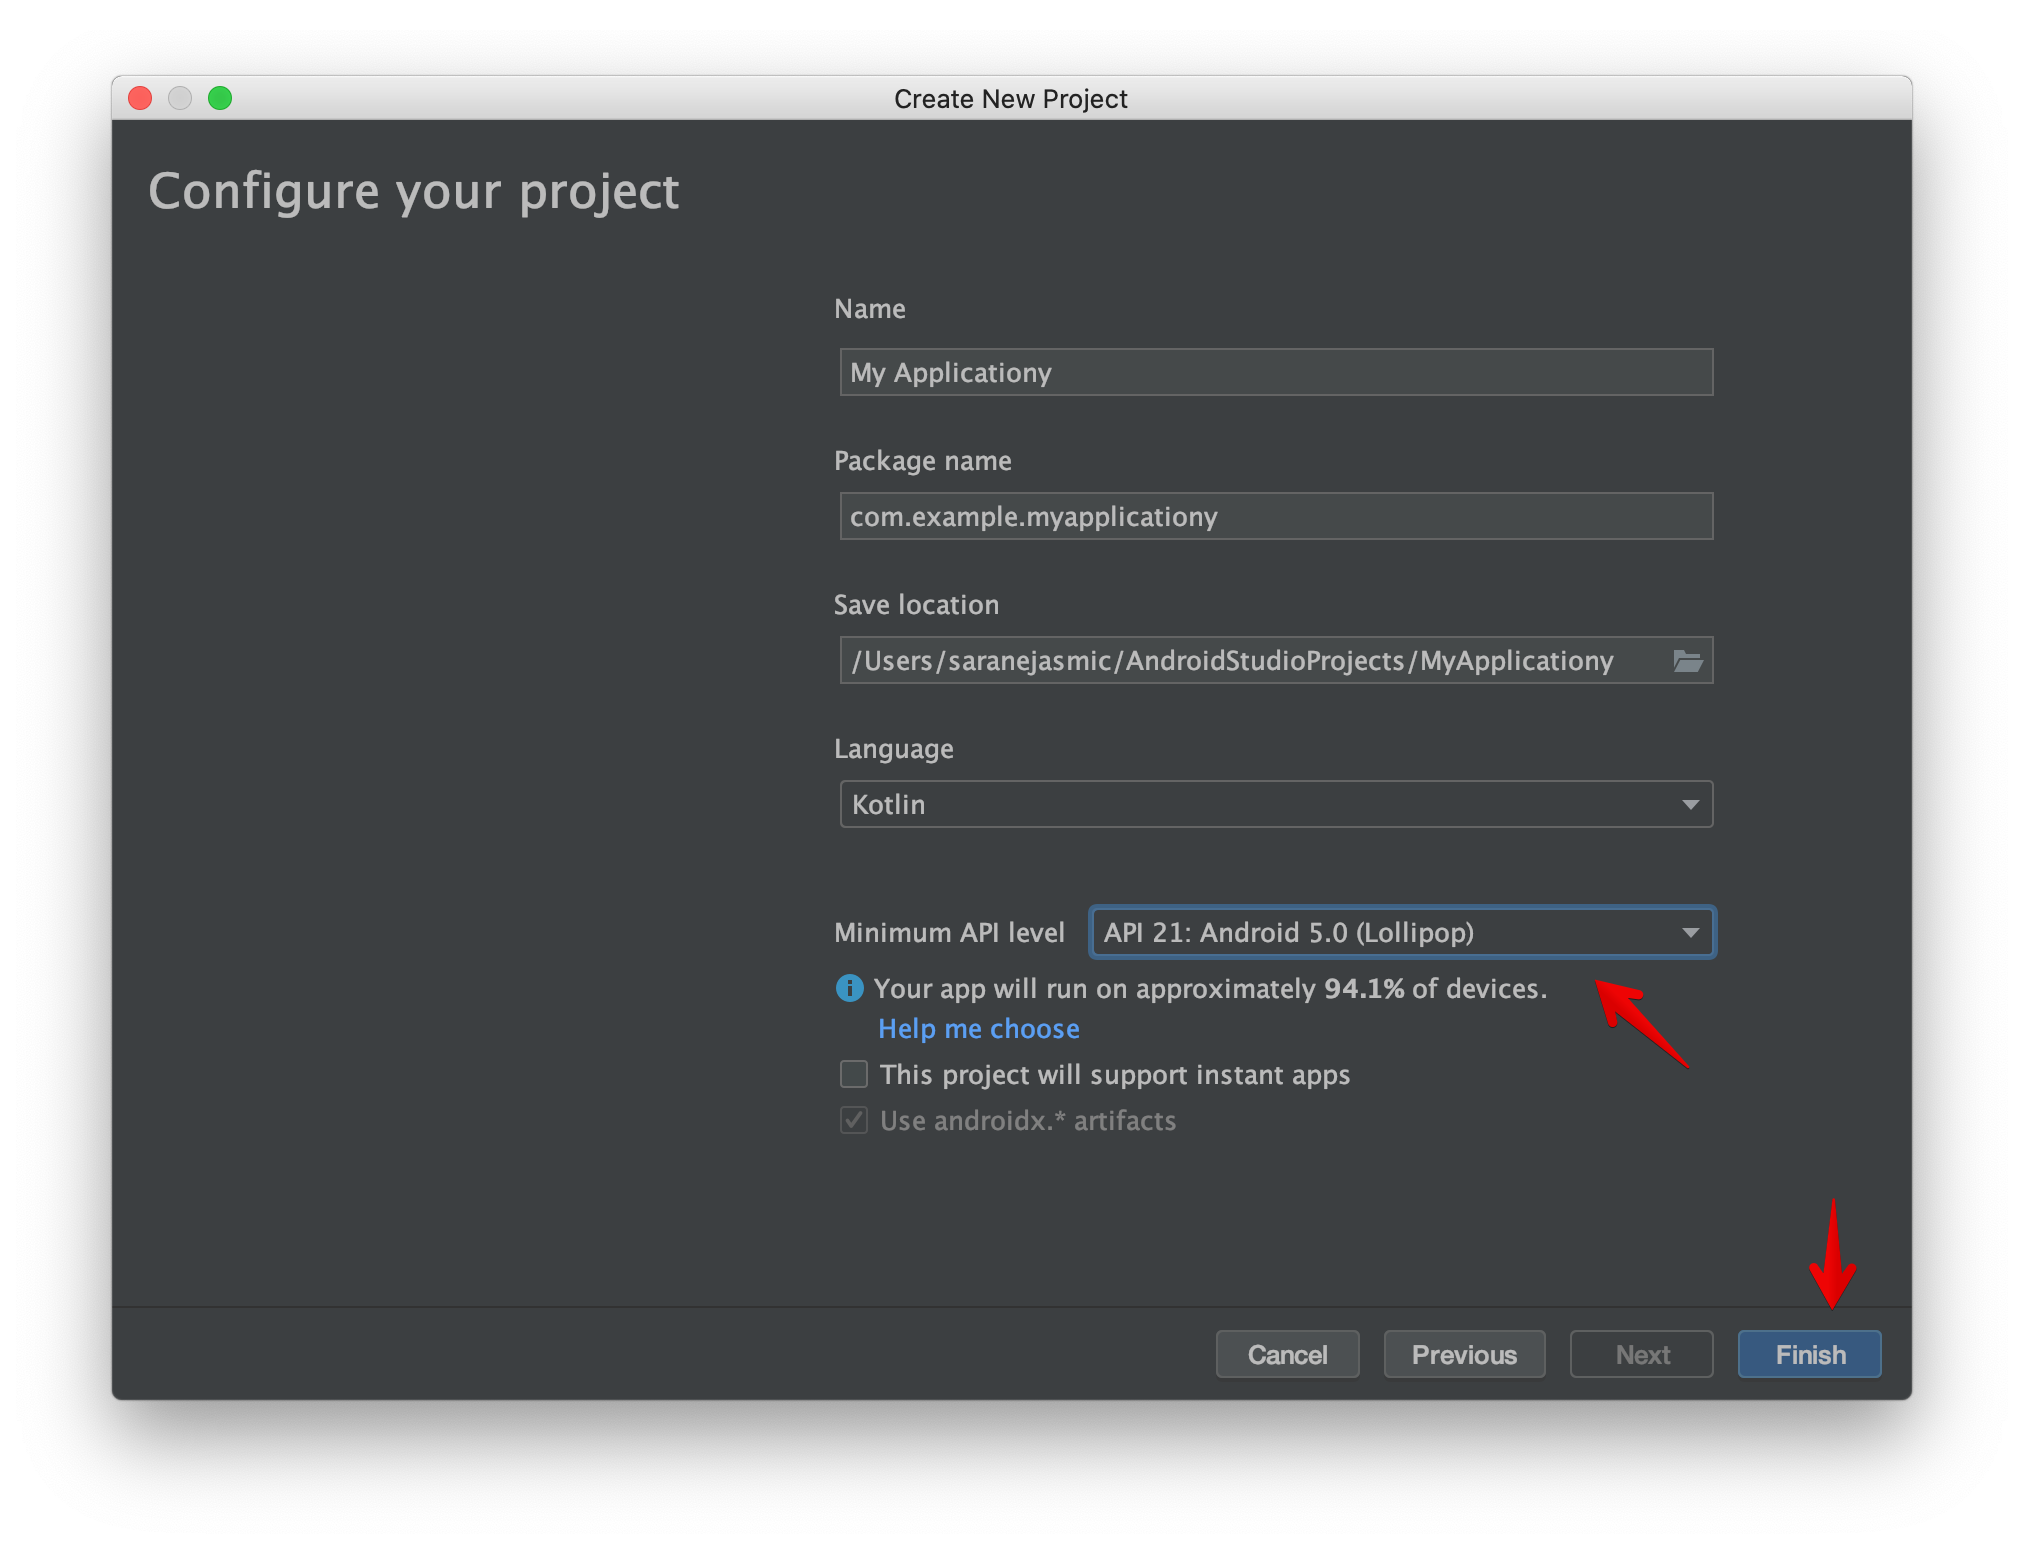
Update the Minimum API level and click Finish to create an empty project.
Connect Android device with USB cable to Macbook and make sure USB debugging is enabled.
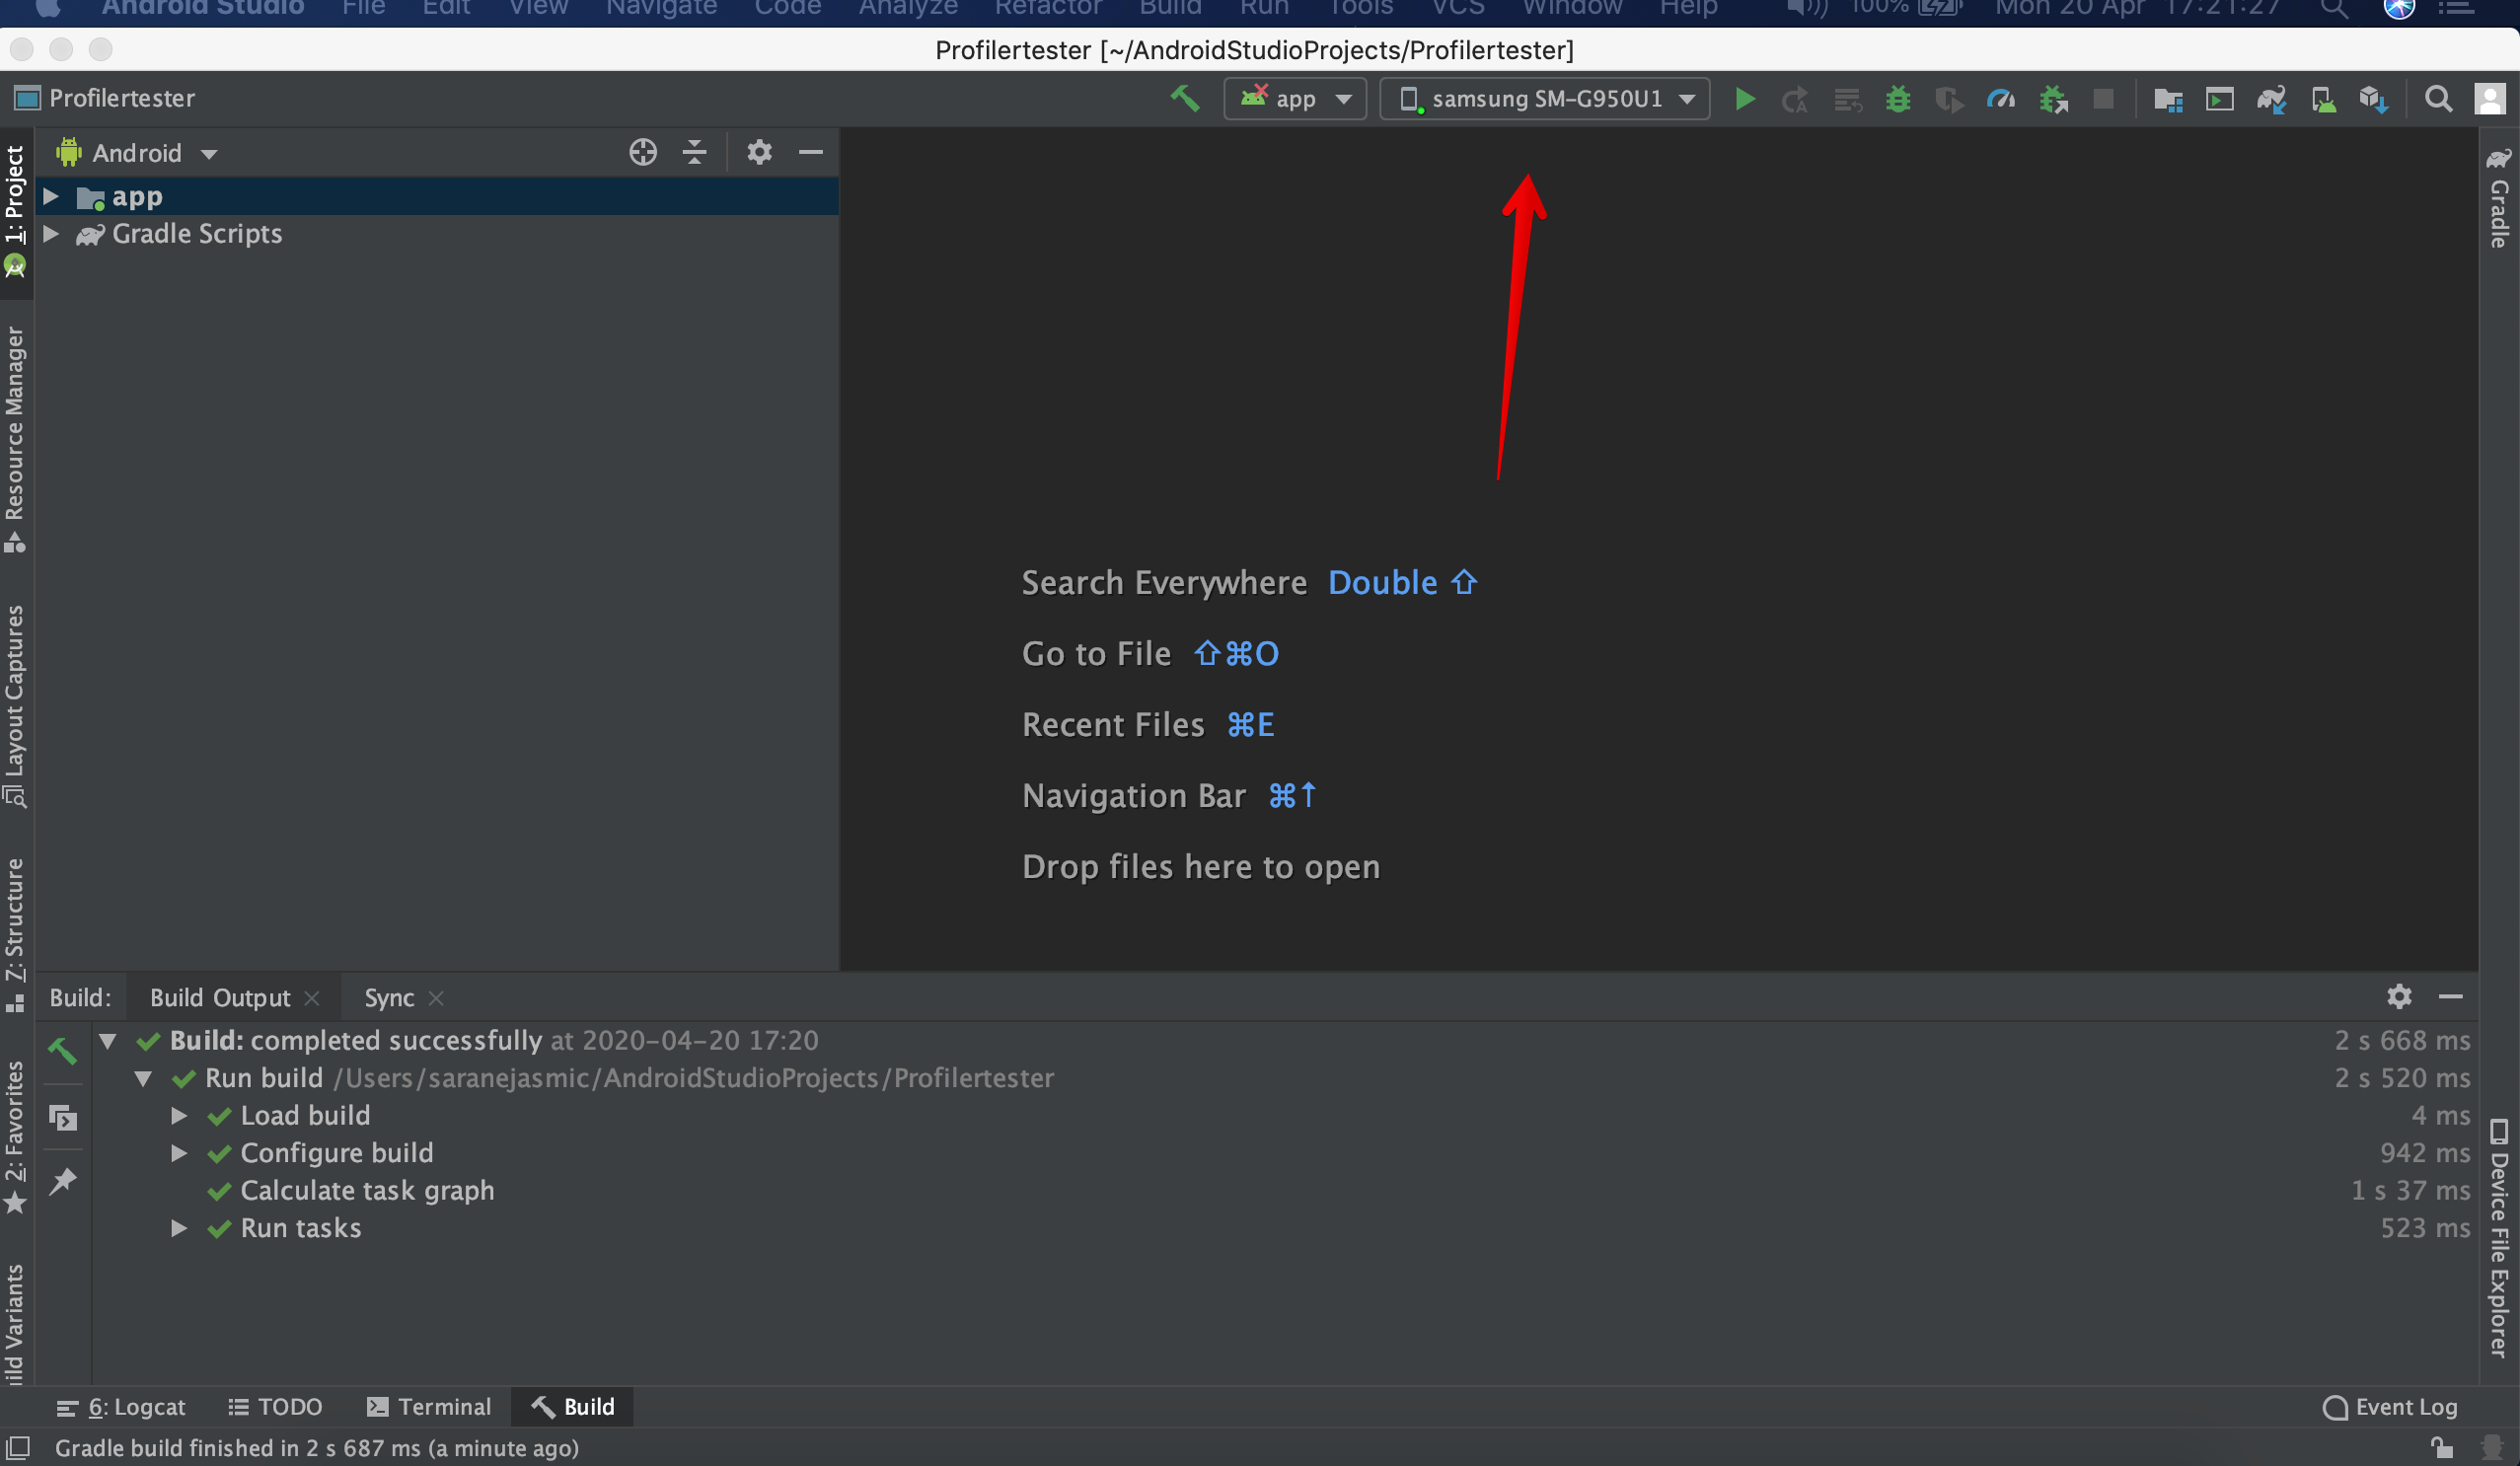
In Android Studio, the connected device will be shown.
Now you need to set up Profiler by going to File > Profile or debug APK > Select APK File (choose debug APK file you want to profile) > click OK.
After APK file is loaded, go to Run > Profile.
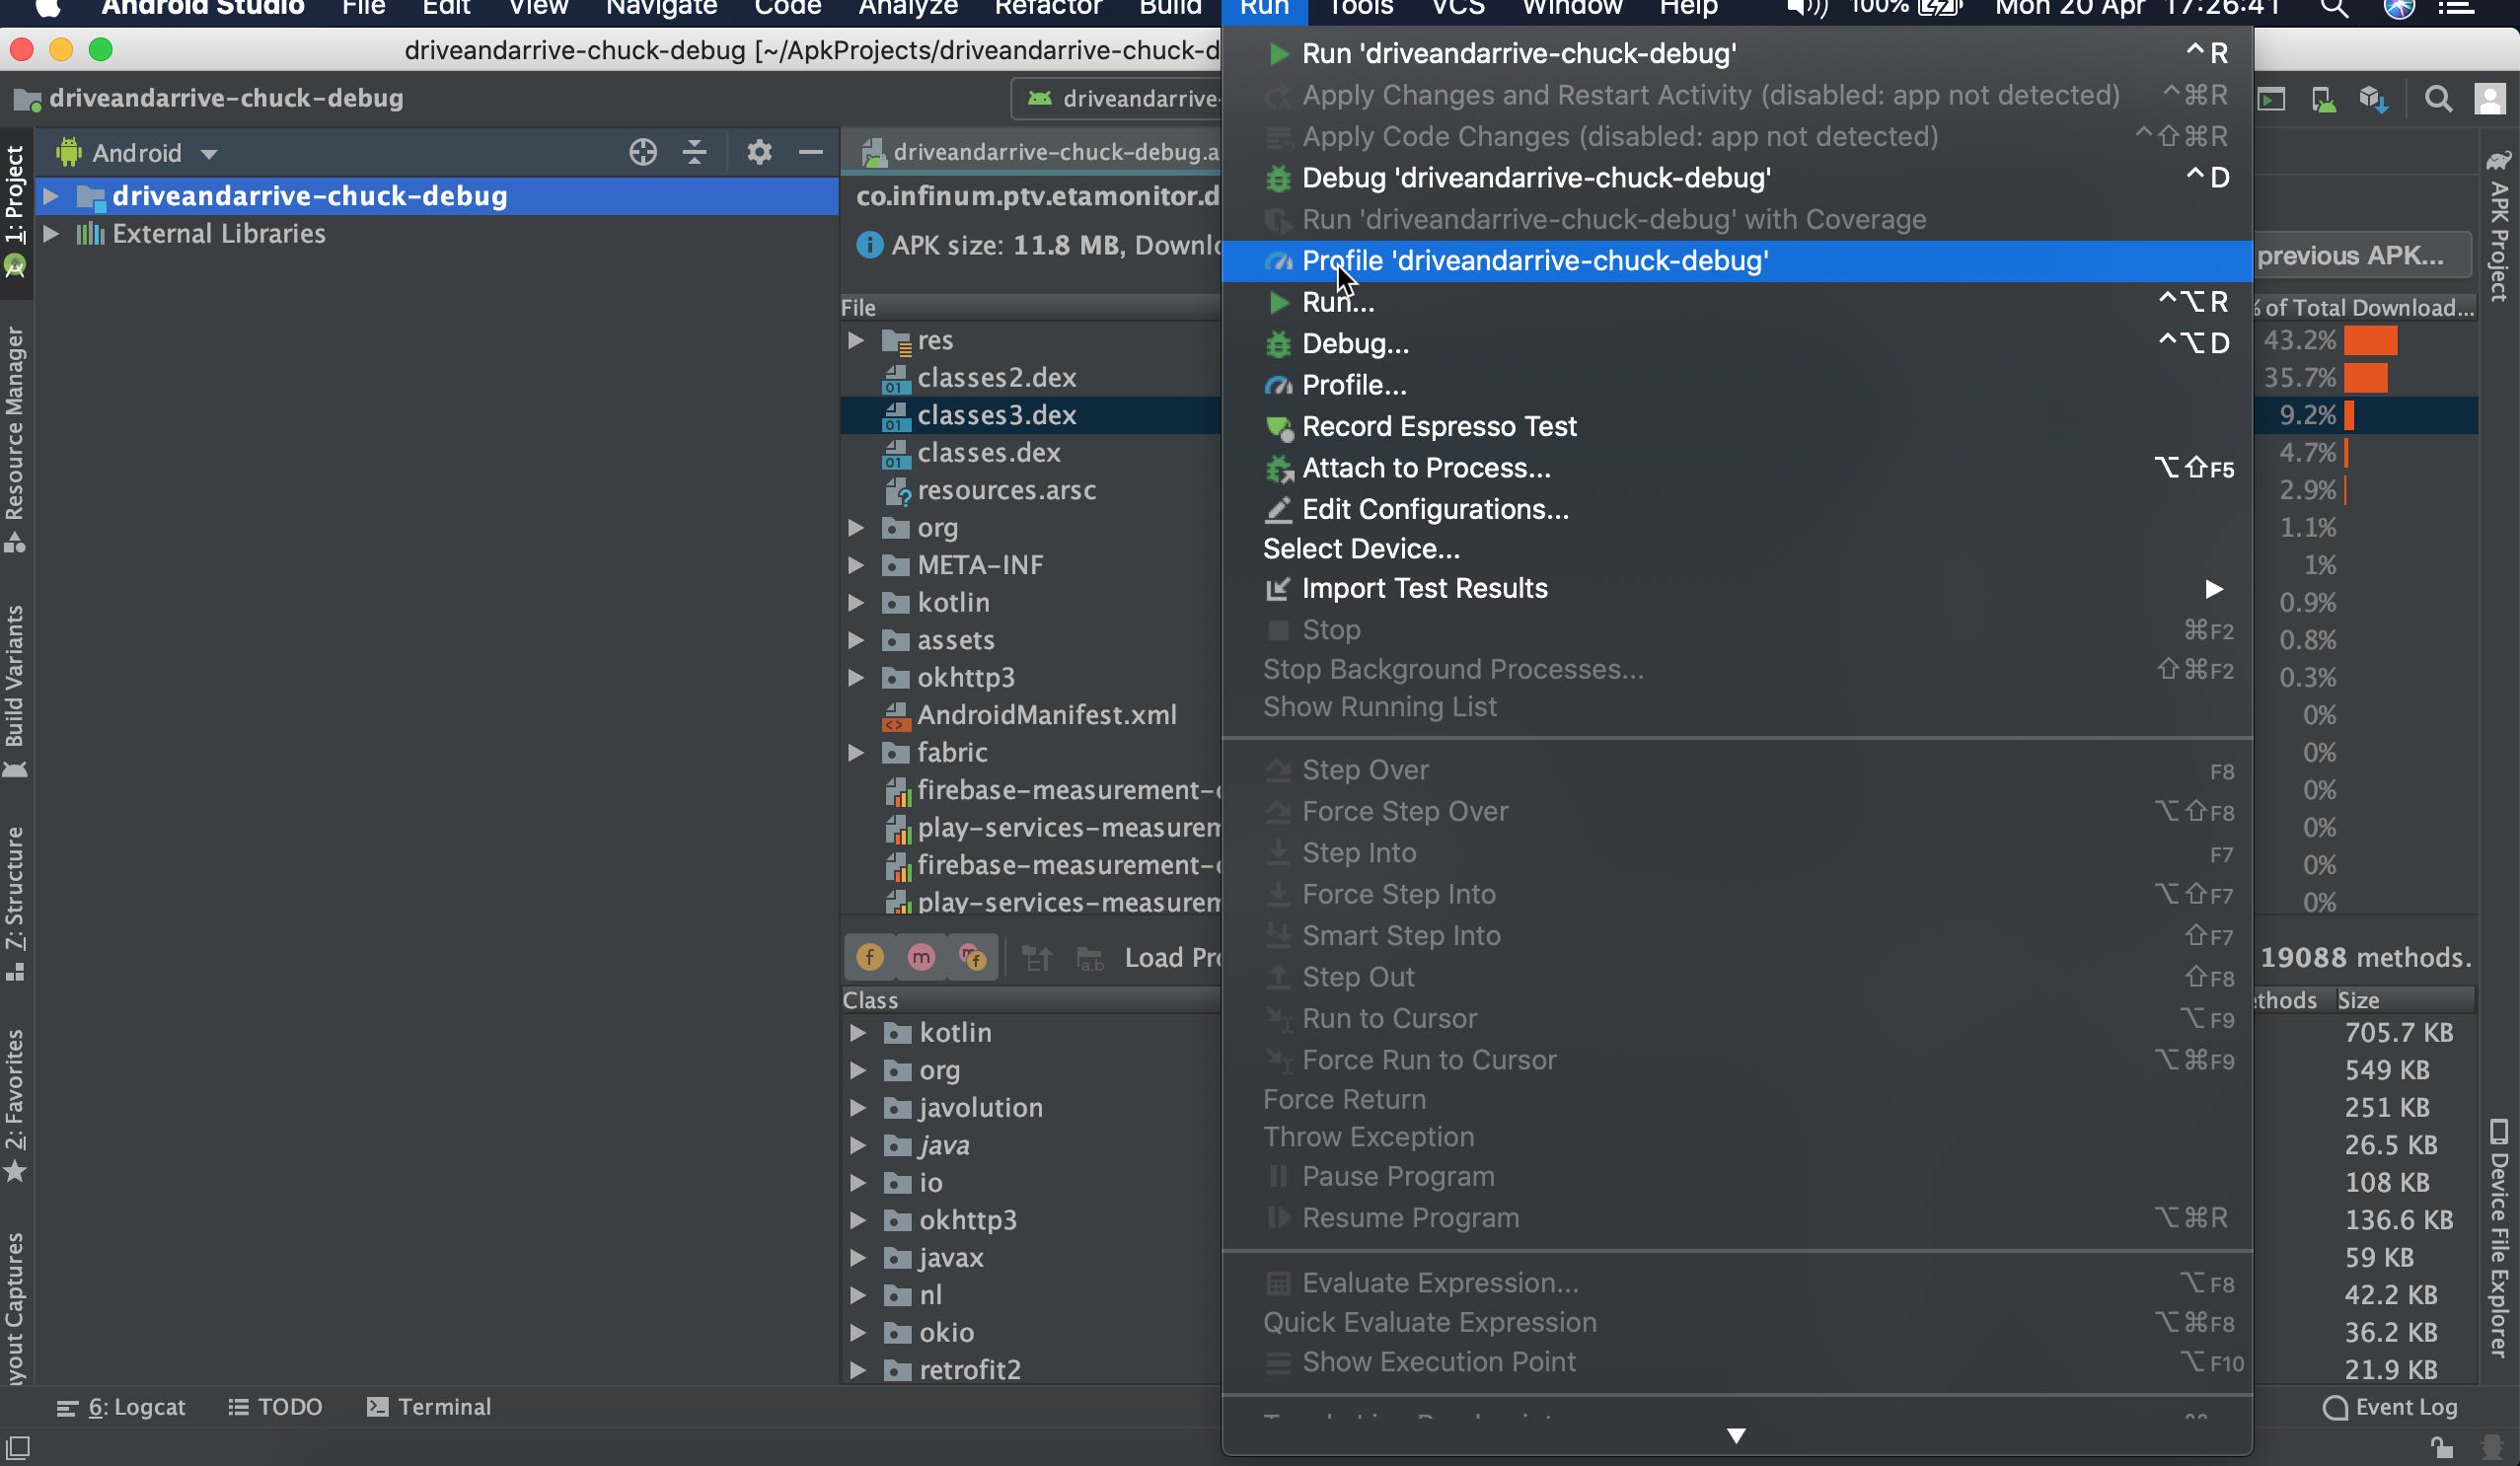
The app will open on your device. Profiler will start with collecting profiling data until you disconnect the device or click End Session.
Android Profiler shared timeline view
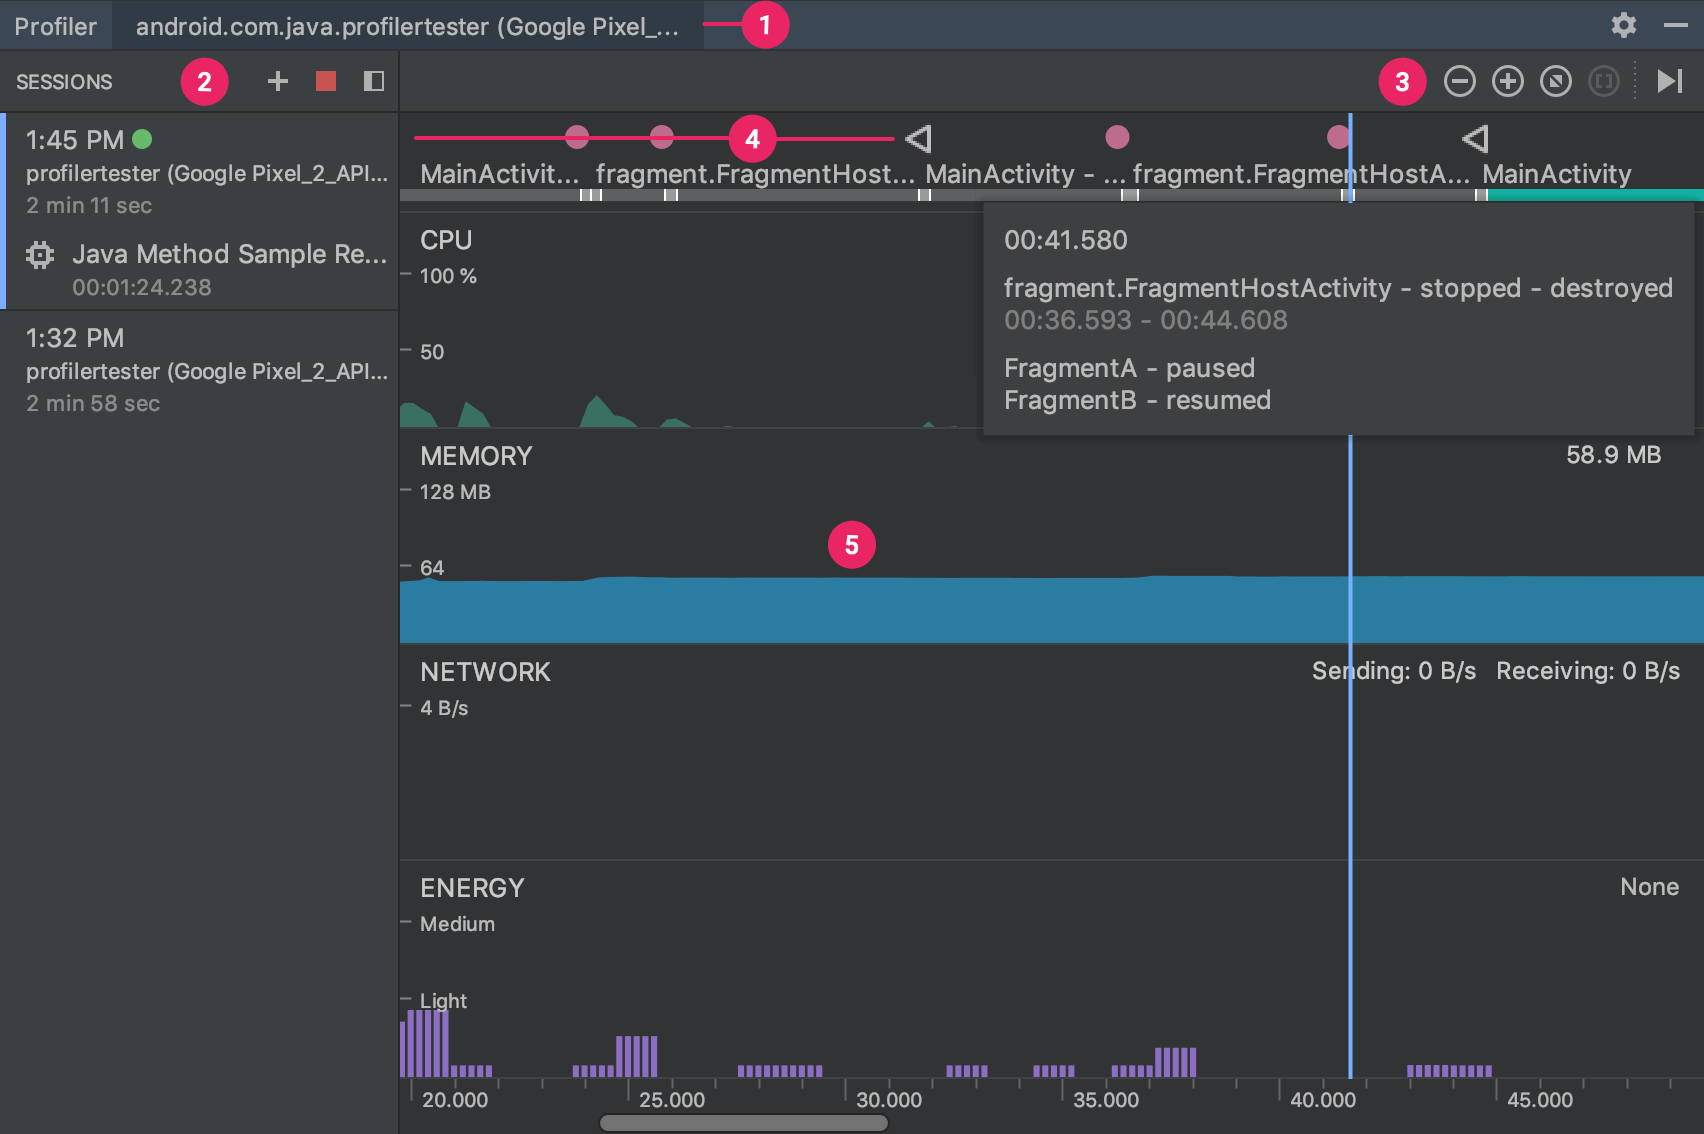
Android Profiler shows the process and device currently being profiled.
In the Sessions pane, choose which session to view, or start a new profiling session.
Use the zoom buttons to control how much of the timeline to view, or use the Attach to live button to jump to the real-time updates.
The event timeline shows events related to user input, including keyboard activity, volume control changes, and screen rotations.
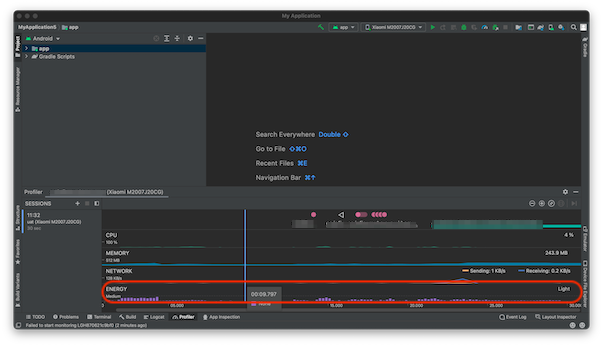
The shared timeline view, which includes graphs for CPU, memory, network, and energy usage.
Profilers
Network Profiler - The Network Profiler displays realtime network activity on a timeline, showing data sent and received, as well as the current number of connections.
Power Profiler - The Power Profiler monitors the use of the CPU, network radio, and GPS sensor, and it displays a visualization of how much energy each of these components uses.
Capture a Heap Dump - Capture a heap dump to identify memory leaks and memory churn that can lead to stutter, freezes, and even app crashes.
CPU Profiler - The CPU Profiler is used to inspect your app's CPU usage and thread activity in real time while interacting with your app, or you can inspect the details in recorded method traces, function traces, and system traces.
Testing battery usage
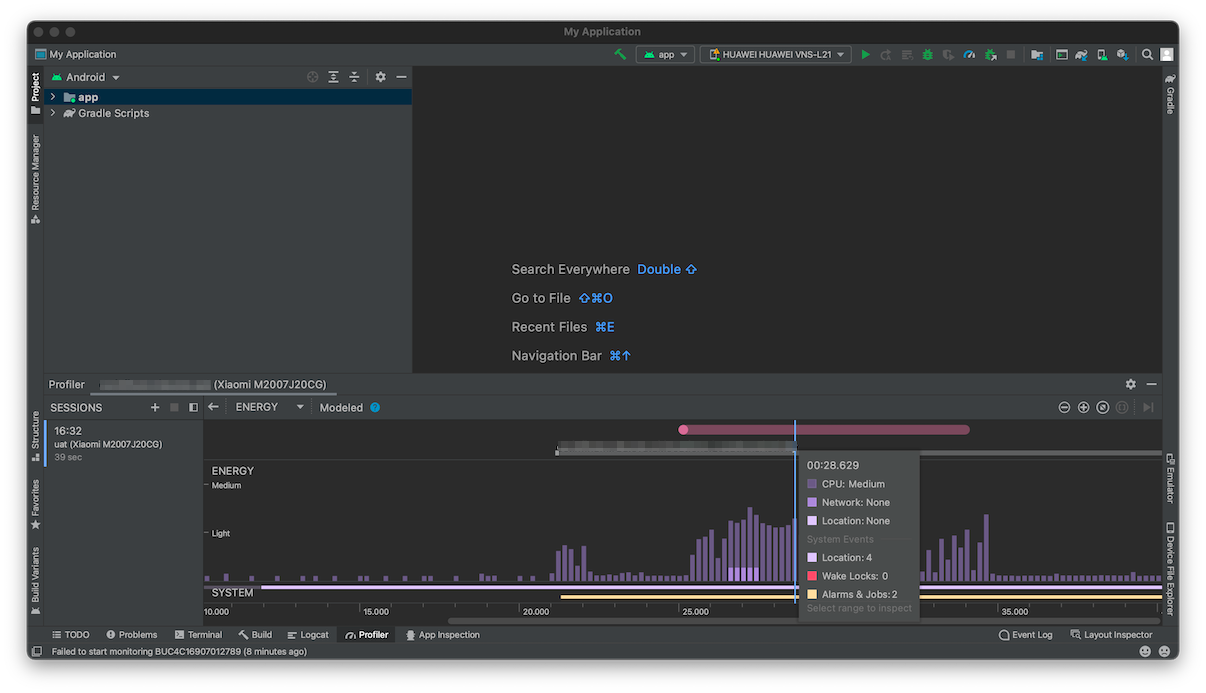
The Power Profiler helps you find where your app uses more energy than necessary. It consists of three timelines: Event timeline, Energy timeline and System timeline. The Profiler monitors the use of CPU, network, GPS and system events and presents them in form of bars and horizontal lines (system events). The higher/longer the bar is, the more energy is being used. You can place a mouse over any part of the timeline for more info.
Prerequisites:
Enabled developer options
- Go to Software info (location varies depending on phone brand)
- Tap multiple times on "Build Number" (or "MIUI version" for Xiaomi devices) until you see a toast message: "You are "X" steps away from being a developer."
- Enable "Developer options" (location varies depending on phone brand)
Enabled USB Debugging + Debug build
- USB debugging (found under "Developer options") set to "ON".
- "Allow USB debugging" prompt set to "OK" and "Always allow from this computer" checked (this prompt shows up when the phone is connected to a computer for the first time).
- Installed debug build of the app you plan to monitor (kindly ask your developer to make one for you). In case your device is rooted, you can monitor any build.
Steps:
- Make sure you have Android Studio installed.
- Click on "New Project".
- Select "No Activity" and click Next.
- Set the "Name" and "Android version" that isn't above the one you are running on your test device (otherwise Android Studio will notify you with a warning).
- Your device should be visible in the top bar, next to the green "Play" button (if it isn’t, check the troubleshooting section of this article).
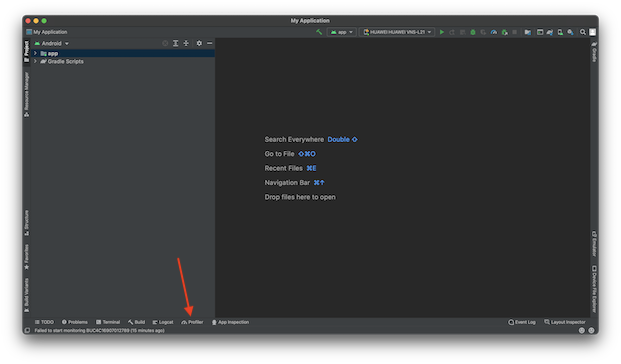
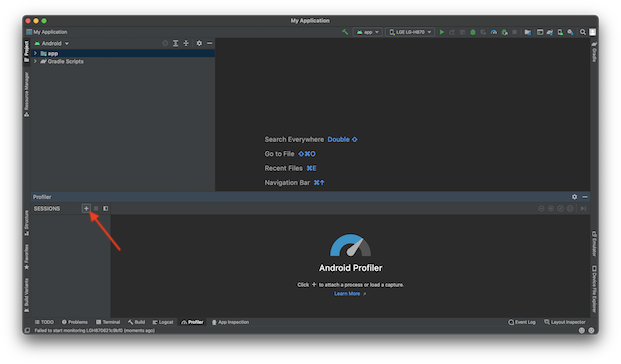
- Click on "Profiler" in the bottom bar of Android Studio.
- Click on "+". Your test device should be present here.
- Select the device and the app you want to monitor. In case your app isn't present, try to run it on your device first to trigger a refresh in Android Studio.
- Once the session starts, the only thing left is to click on the "Energy" timeline to zoom on battery consumption. The monitoring lasts until you press the "Stop" button. After stopping, you can inspect the recorded session.
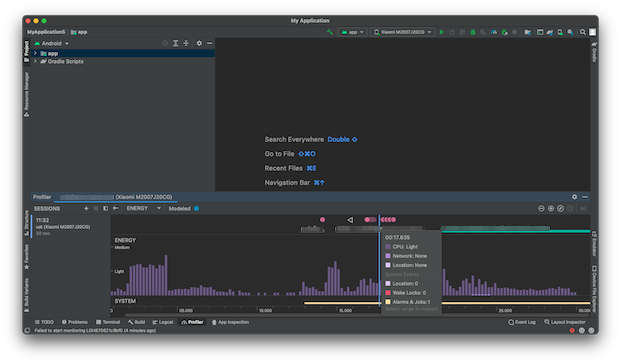
The Power Profiler provides the user with insight into the usage of these events and processes to check if there are any excessive impacts on the battery.
Troubleshooting - what to do if it doesn't work
- Check if you have ADB installed on your computer (if your are not sure or ask yourself "What is ADB?" check our handbook).
- Check if you set "USB debugging" to "ON".
- Try the "Revoke USB debugging authorizations" option, disconnect the phone, connect it again and allow the connection via the prompt that shows up.
- Try other USB cables.
It is not so uncommon to connect the phone to a computer by micro USB cable, only to find out that the cable you used can only charge the device (more info).
USB-C cables are a bit better in that aspect but even they aren't all the same. - Make sure that the app you plan to monitor is a debug build.
- In case you don't see the app you want to monitor in Android Studio - try to run it on the device first, that should trigger a refresh in Android Studio.
Running Android Profiler without Android Studio
There is an option to run Android Profiler without running full Android Studio.
The only requirement is Java installed on the computer you are using and that the Profiler isn’t currently running inside Android Studio.