Blame doesn't fix bugs. - Anonymous
Basic info
Here we will mention basic stuff about Chrome Dev tools, why it is important for QA and what features we use.
What the heck is it?
Chrome DevTools is a set of web developer tools built directly into the Google Chrome browser. It is available in any version of Chrome browser.
Every browser has developer tools, and they look similar for almost all browsers. Chrome web browser is the most common in usage that's why we write about it.
Why do we use it?
We use it for easier testing, to improve our bug reports and help developers with bug fixing.
Etc. use Chrome Dev tools in these situations:
- when there is a backend bug and you can not see it on UI
- when you want to clear cache, cookies or server data
- when you want to check if the page is implemented by design
- when you want to see if the frontend app is sending requests to backend
Practical stuff
How to use
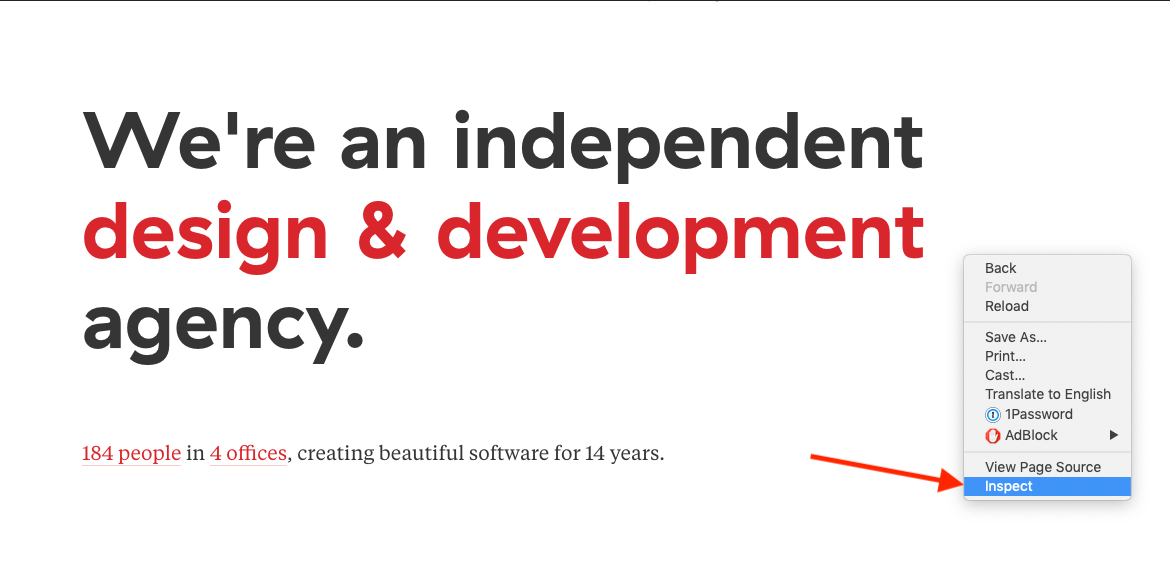
You can open dev tools with F12 button or right click - inspector After that you will be placed in Elements tab.
Elements panel
In elements panel you can see page structure in HTML and CSS.
What are HTML and CSS?
A Web page is made up from HTML and CSS code. HTML defines the structure of the web page and CSS defines visual representation of HTML elements. Every browser can render HTML and CSS code. Here is more info about HTML and CSS:
Inspect element
Two most common ways of inspecting elements are:
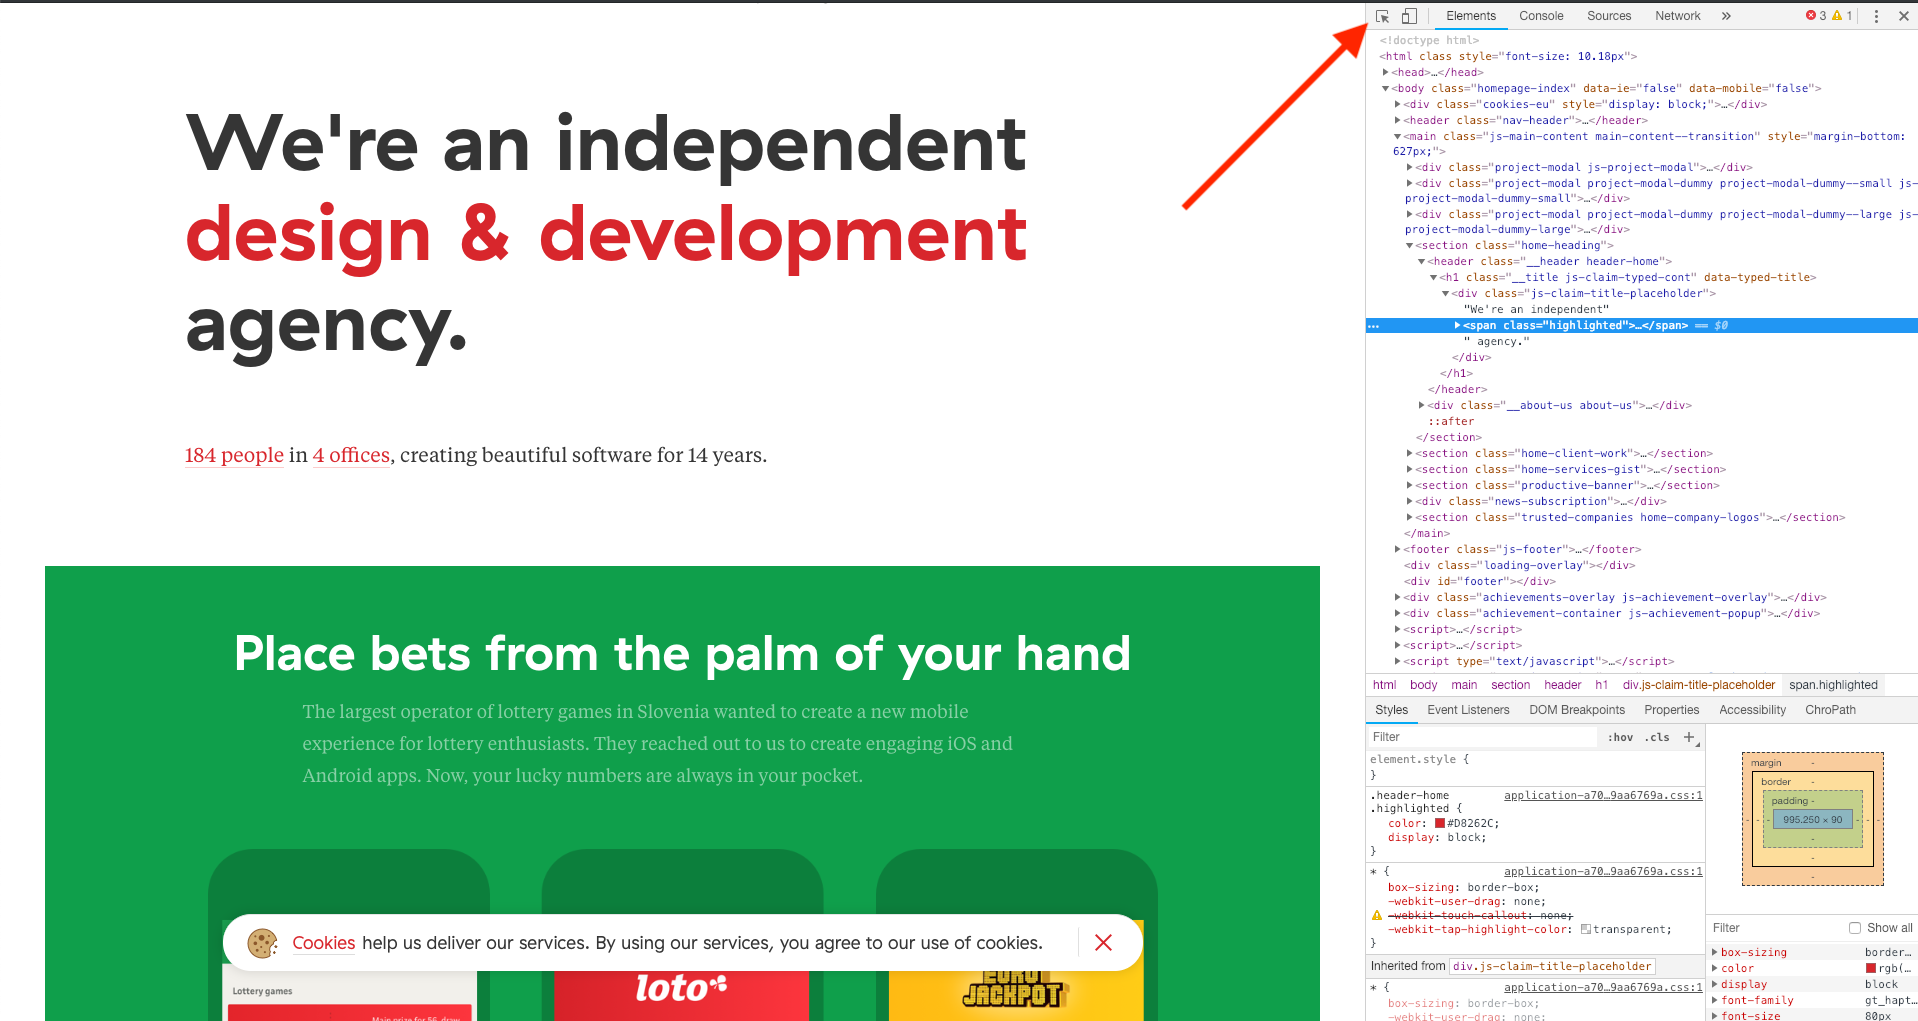
- via Inspect element icon
- hovering with mouse over the HTML code
Inspect element icon is placed in upper left corner of dev tools.
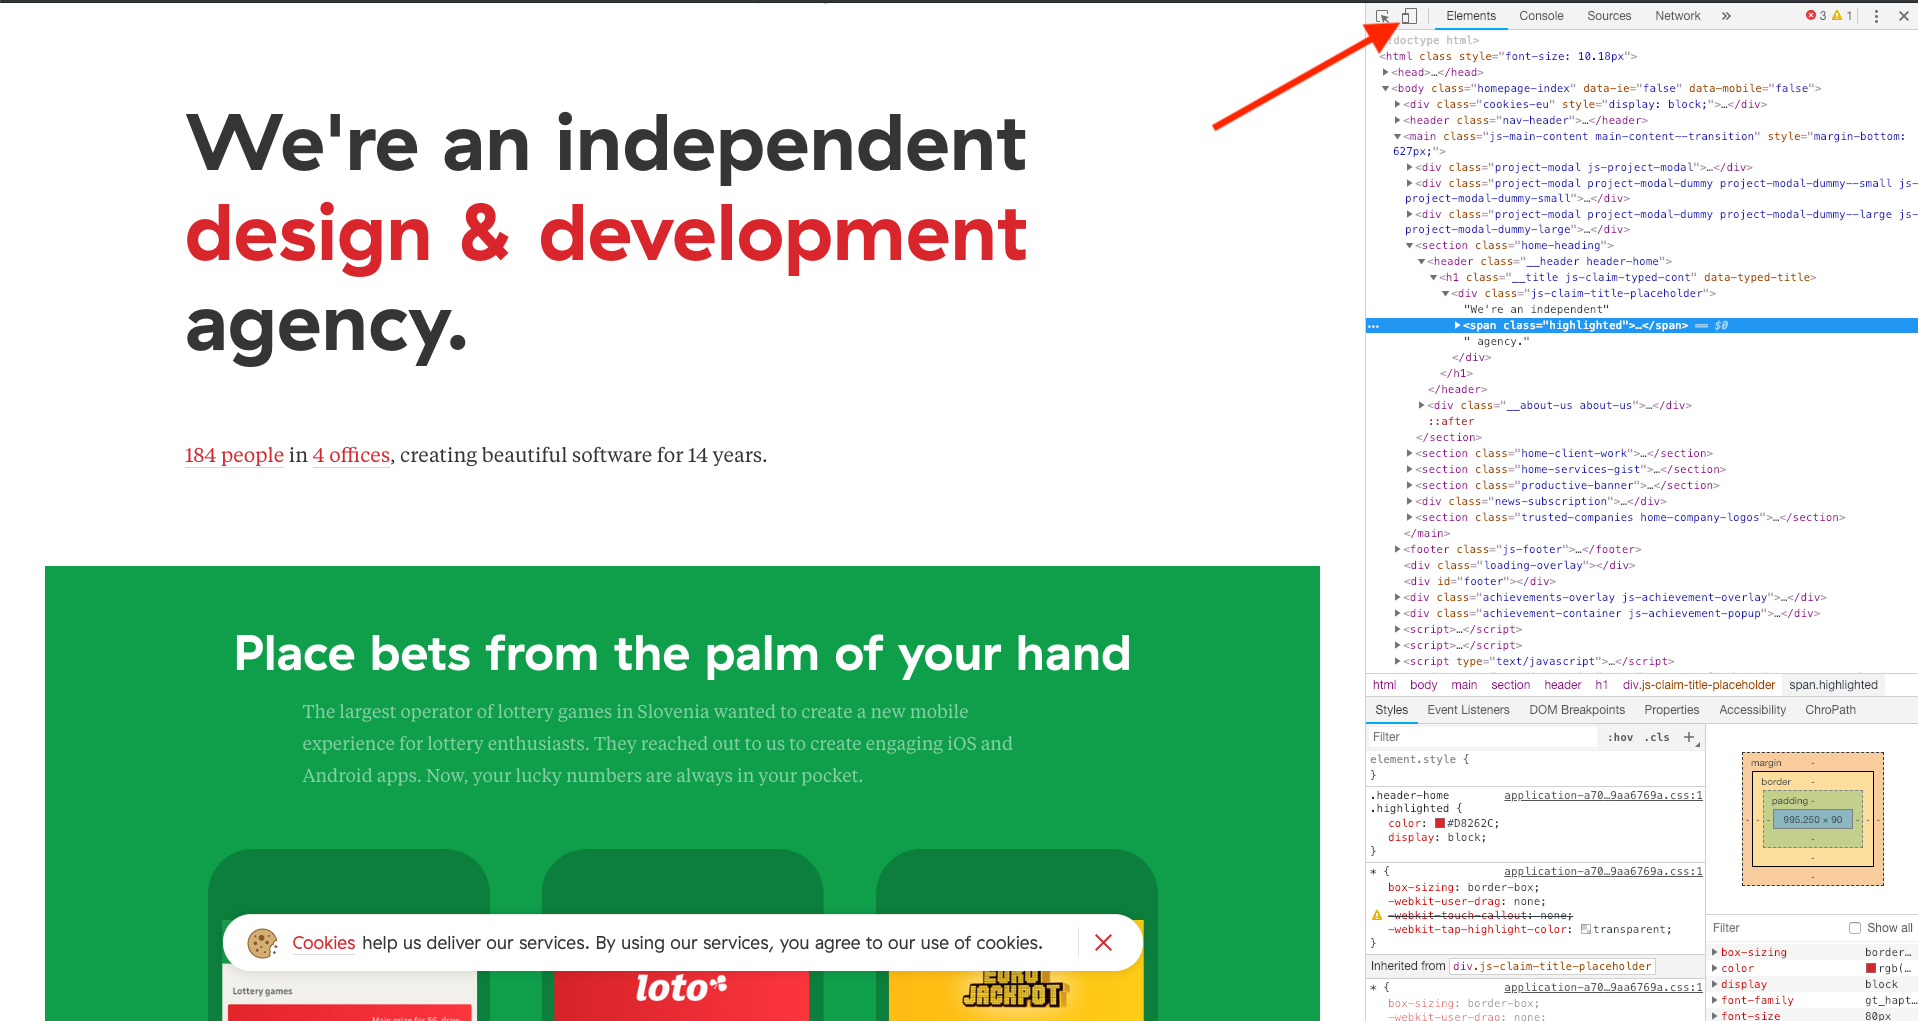
Device toolbar
Chrome dev tools provide the check on the multiple mobile resolutions via device toolbar. Device toolbar icon is placed next to inspect element icon in upper left corner of dev tools. You can use responsive design by clicking on Toggle device toolbar icon.
While it is preferable to check the issue on the actual device, there are some cases in which Device toolbar is acceptable to use:
- when there is no device available
- when you are in a hurry, need to test something fast
- when something is a quick fix and is not related to mobile layout
Note that some bugs will appear only on an actual device while with dev tools they won't
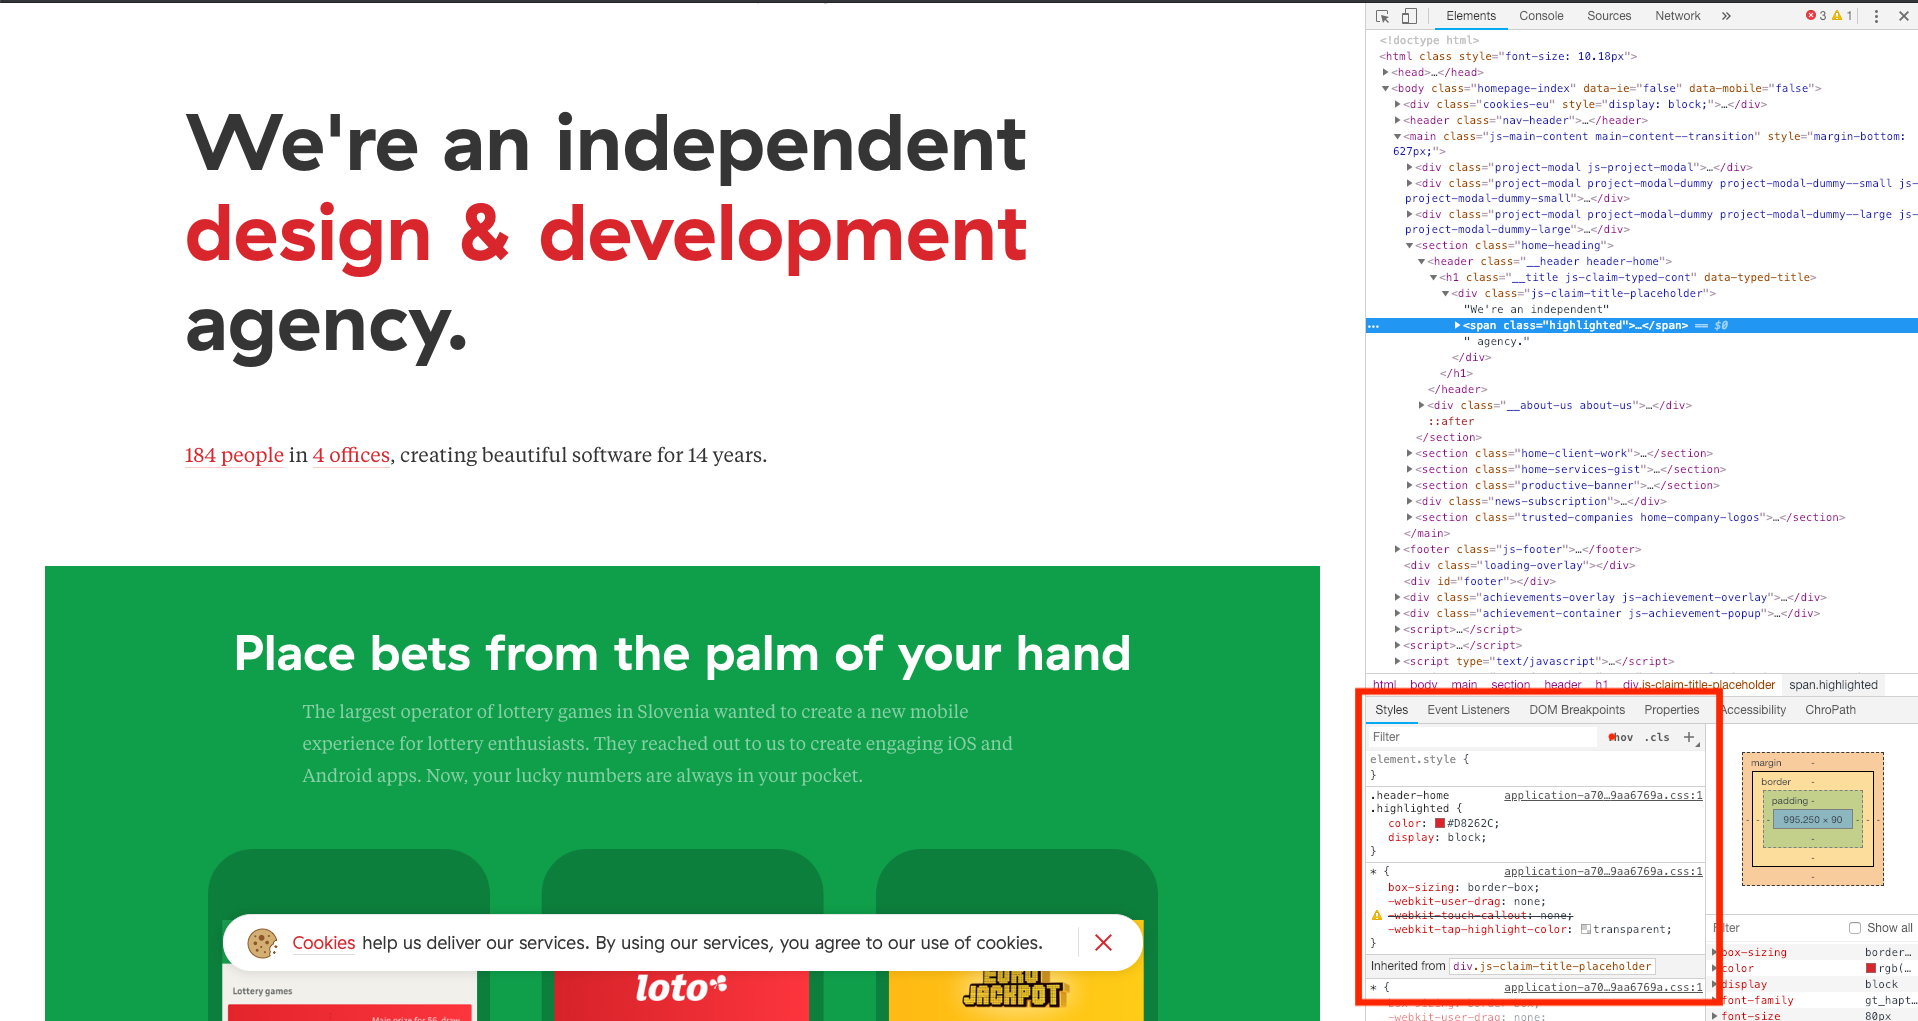
Styles tab
It is placed bellow the page. We use it to check the CSS property of selected element.
Here we can add modify or remove CSS property of selected element and change the page UI. Changes you made will not be applied to actual page, you can refresh the page and return to old look
We use Elements panel when:
- we want to check that the page is implemented by design (Check CSS property of the page).
- we want to make improvement, move element left or right increase padding, change text or similar.
- in automation when we want to locate the element.
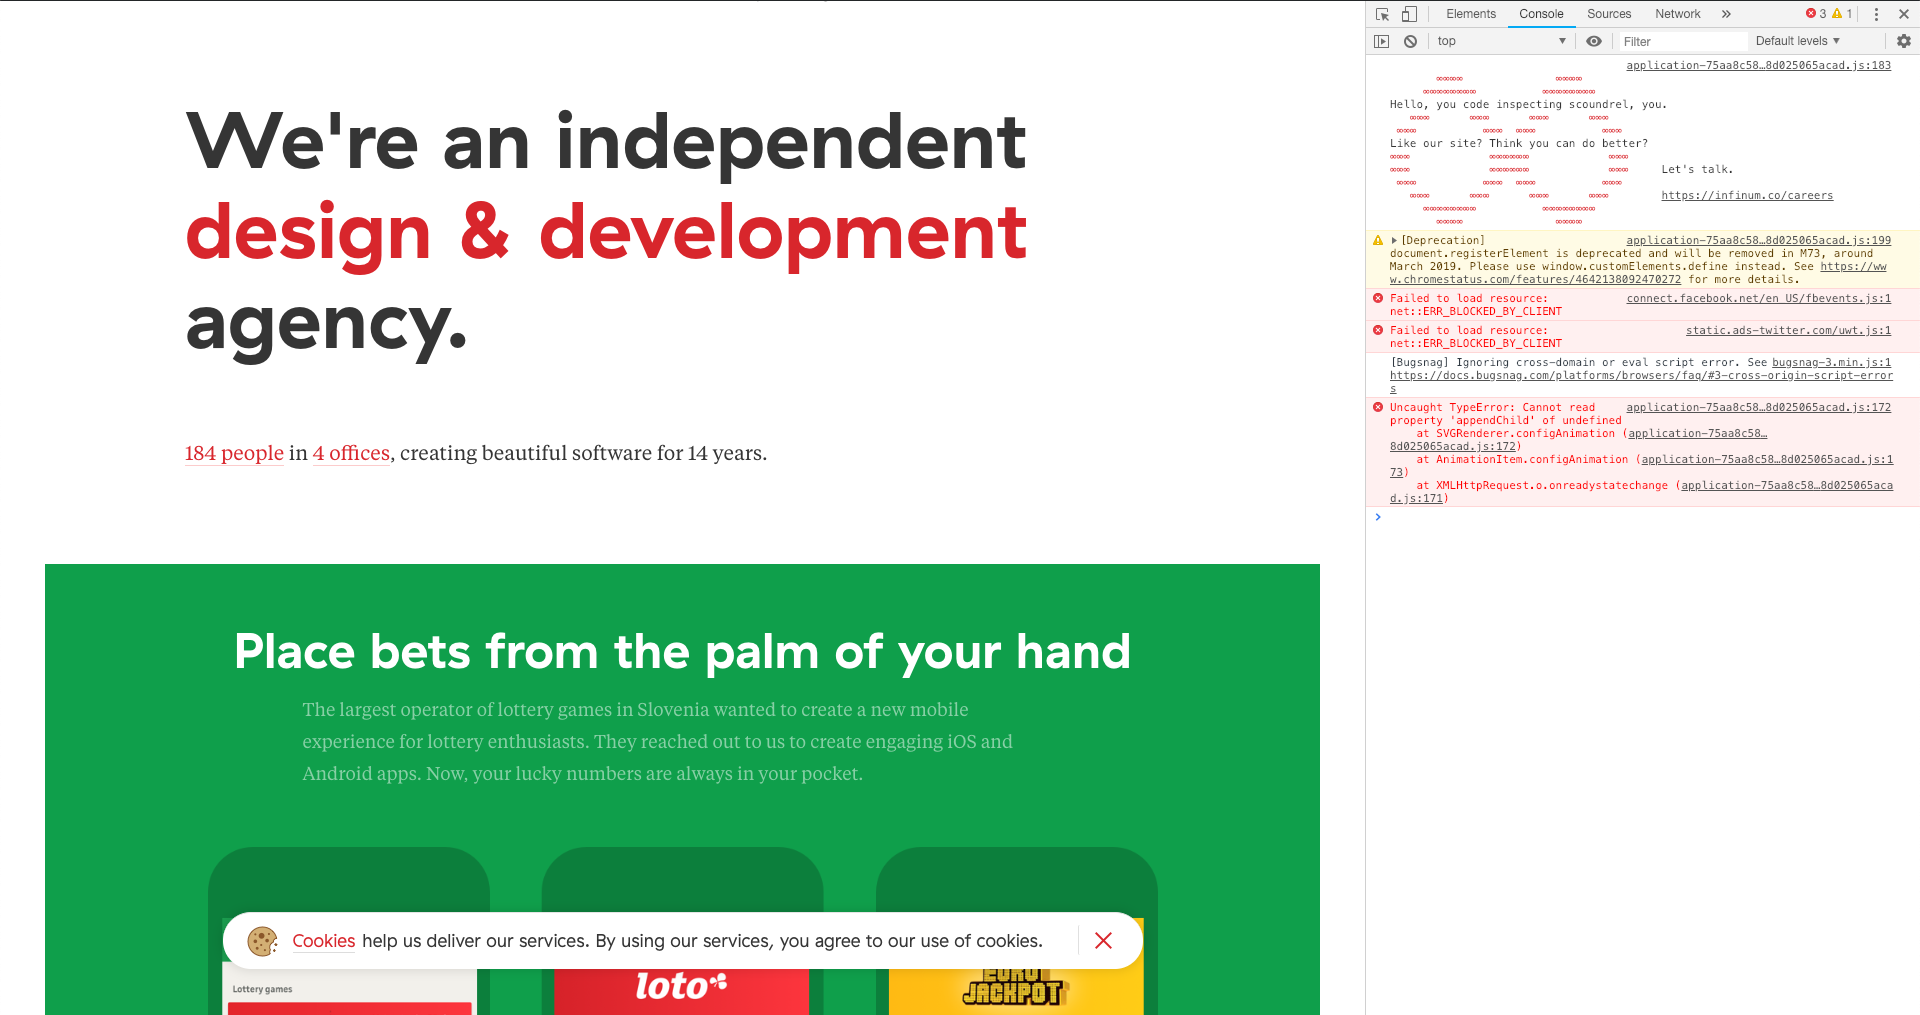
Console
There may be times that you don’t see any of your experiment changes on the UI part of the site. In console panel you will see errors marked in red. Errors are usually fatal when the page is not working as expected.
Note: there will be console error on every page but you need to report only fatal error
Use the console in following cases:
- When you click on some element and nothing happens
- When you are constantly getting error from the server
- When page elements are not loaded
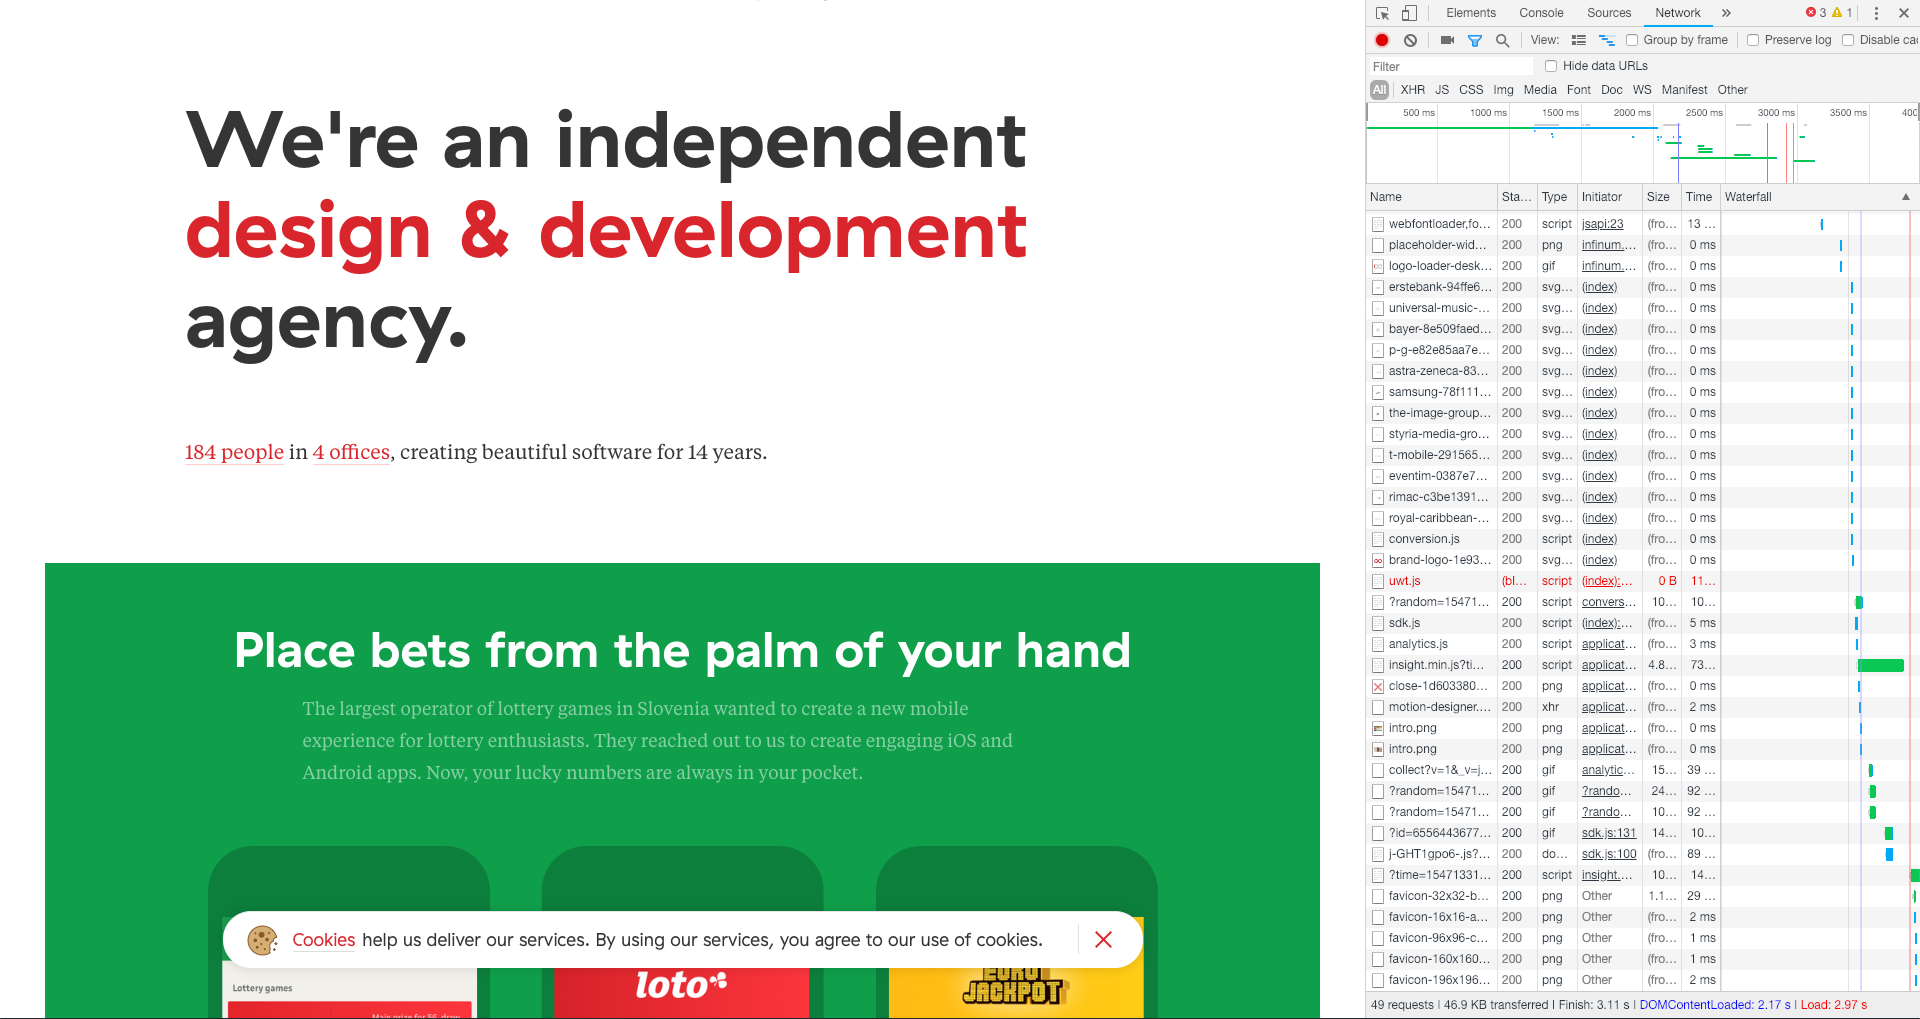
Network panel
The Network panel records information about each network operation on your site, including detailed timing data, HTTP request and response headers, cookies, WebSocket data, and more.
In other words, in the network panel you can see all the data that is coming from the server. This data is needed for the page to load.
When to use network tab:
- when we want to see the received content from the server
- when we want to see status of some request
- when we want to see how much time does it take for request
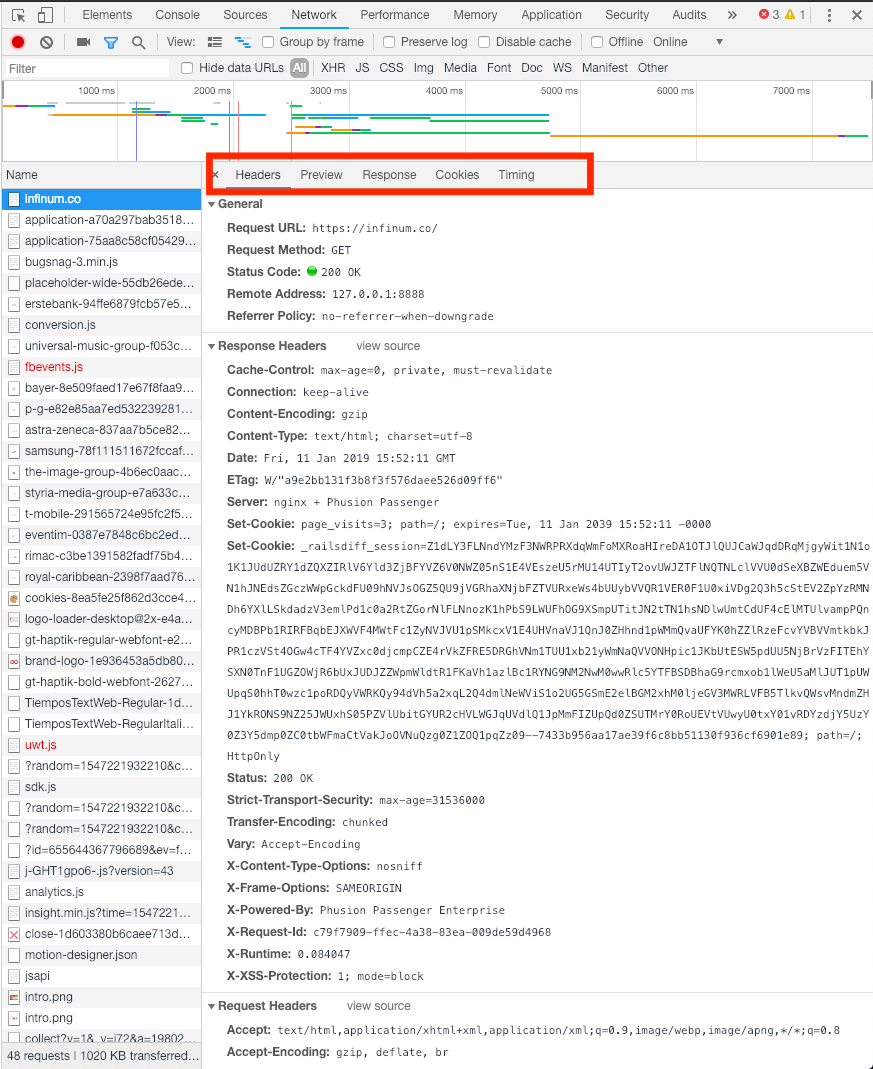
Check the request status from network panel:
In case when you have to check response that you get from the server you should do the folowing:
- Click on network panel in inspector
- Reload the page
- You will see network requests
- Click on one of network requests
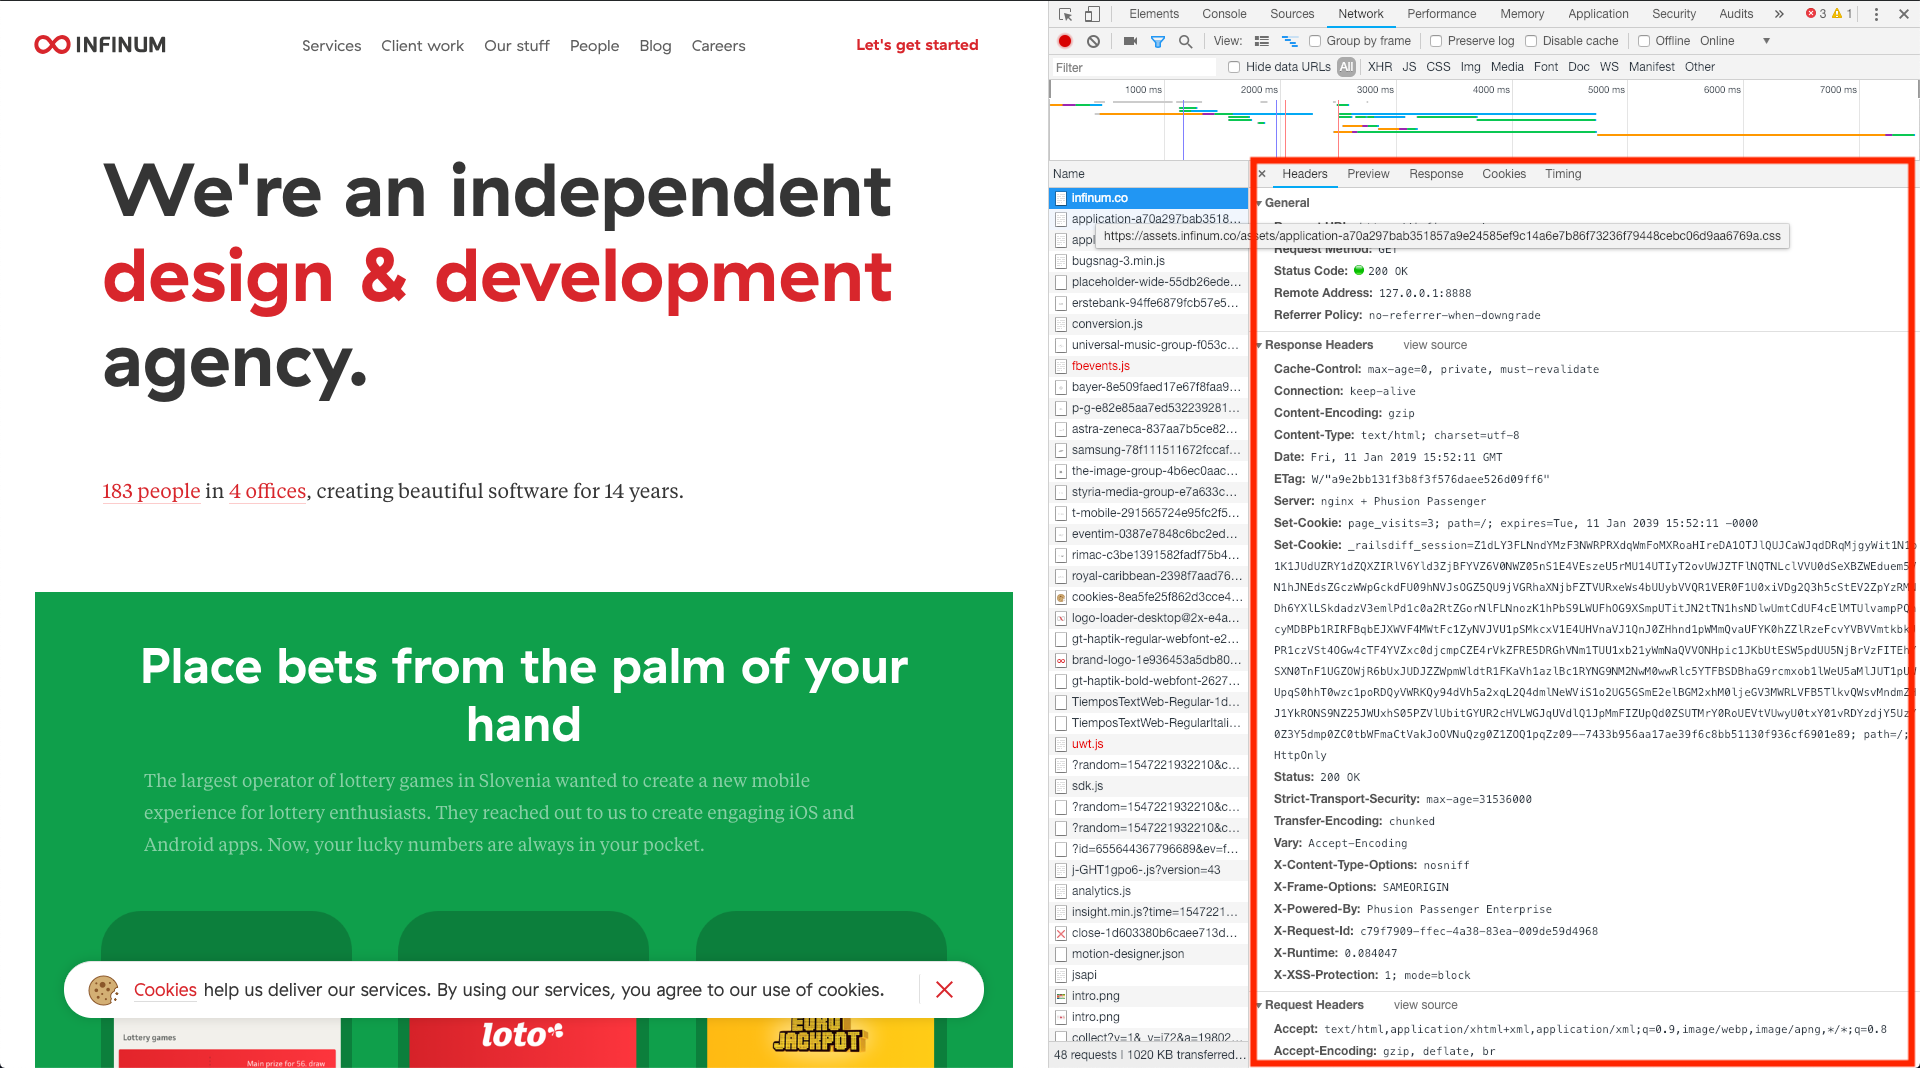
You can check request status and all kinds of request information in headers. You can also see the request content and preview it in one of the following options.
Lighthouse
Lighthouse is a tool used for analyzing web apps and web pages. It collects performance, accessibility, SEO metrics, and more. It's integrated directly into the Chrome DevTools, under the "Lighthouse" panel.
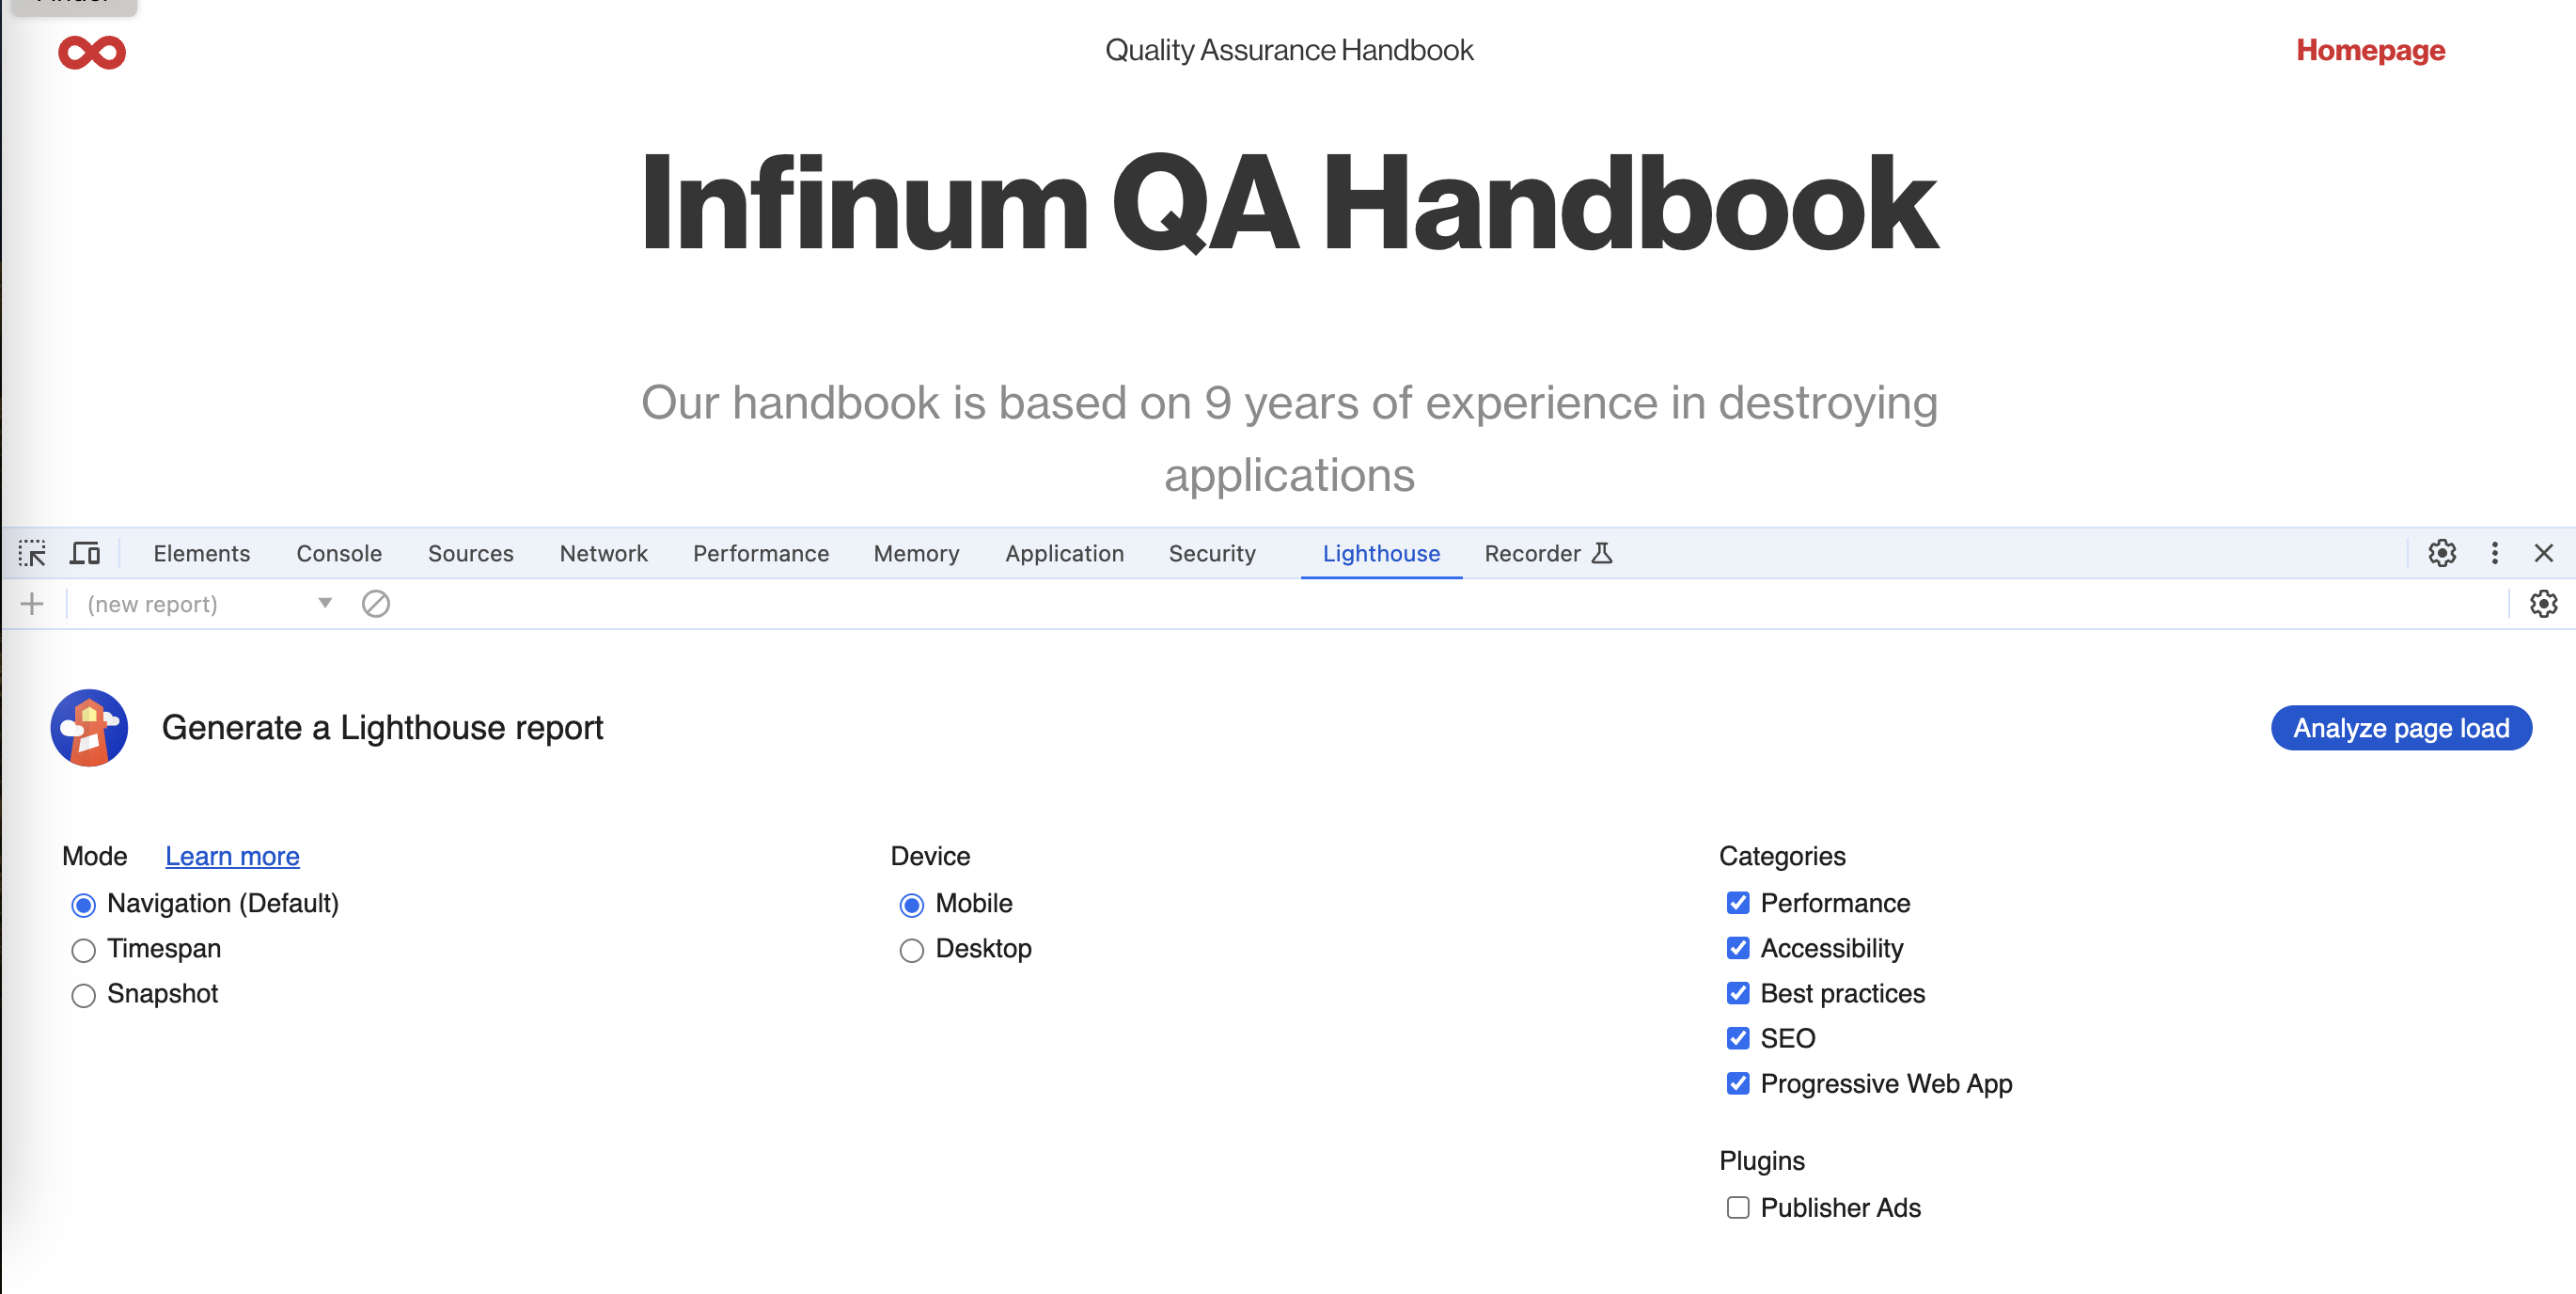
To generate a Lighthouse report, go to the web page you want to test, open Lighthouse from Dev Tools, select Mode, Device, and categories, and click the Analyze page load button. Once the report is generated, it will give you 4 core aspects about Performance, Accessibility, Best Practices, and SEO. On the right side there is a menu with options to print, copy, or download report.
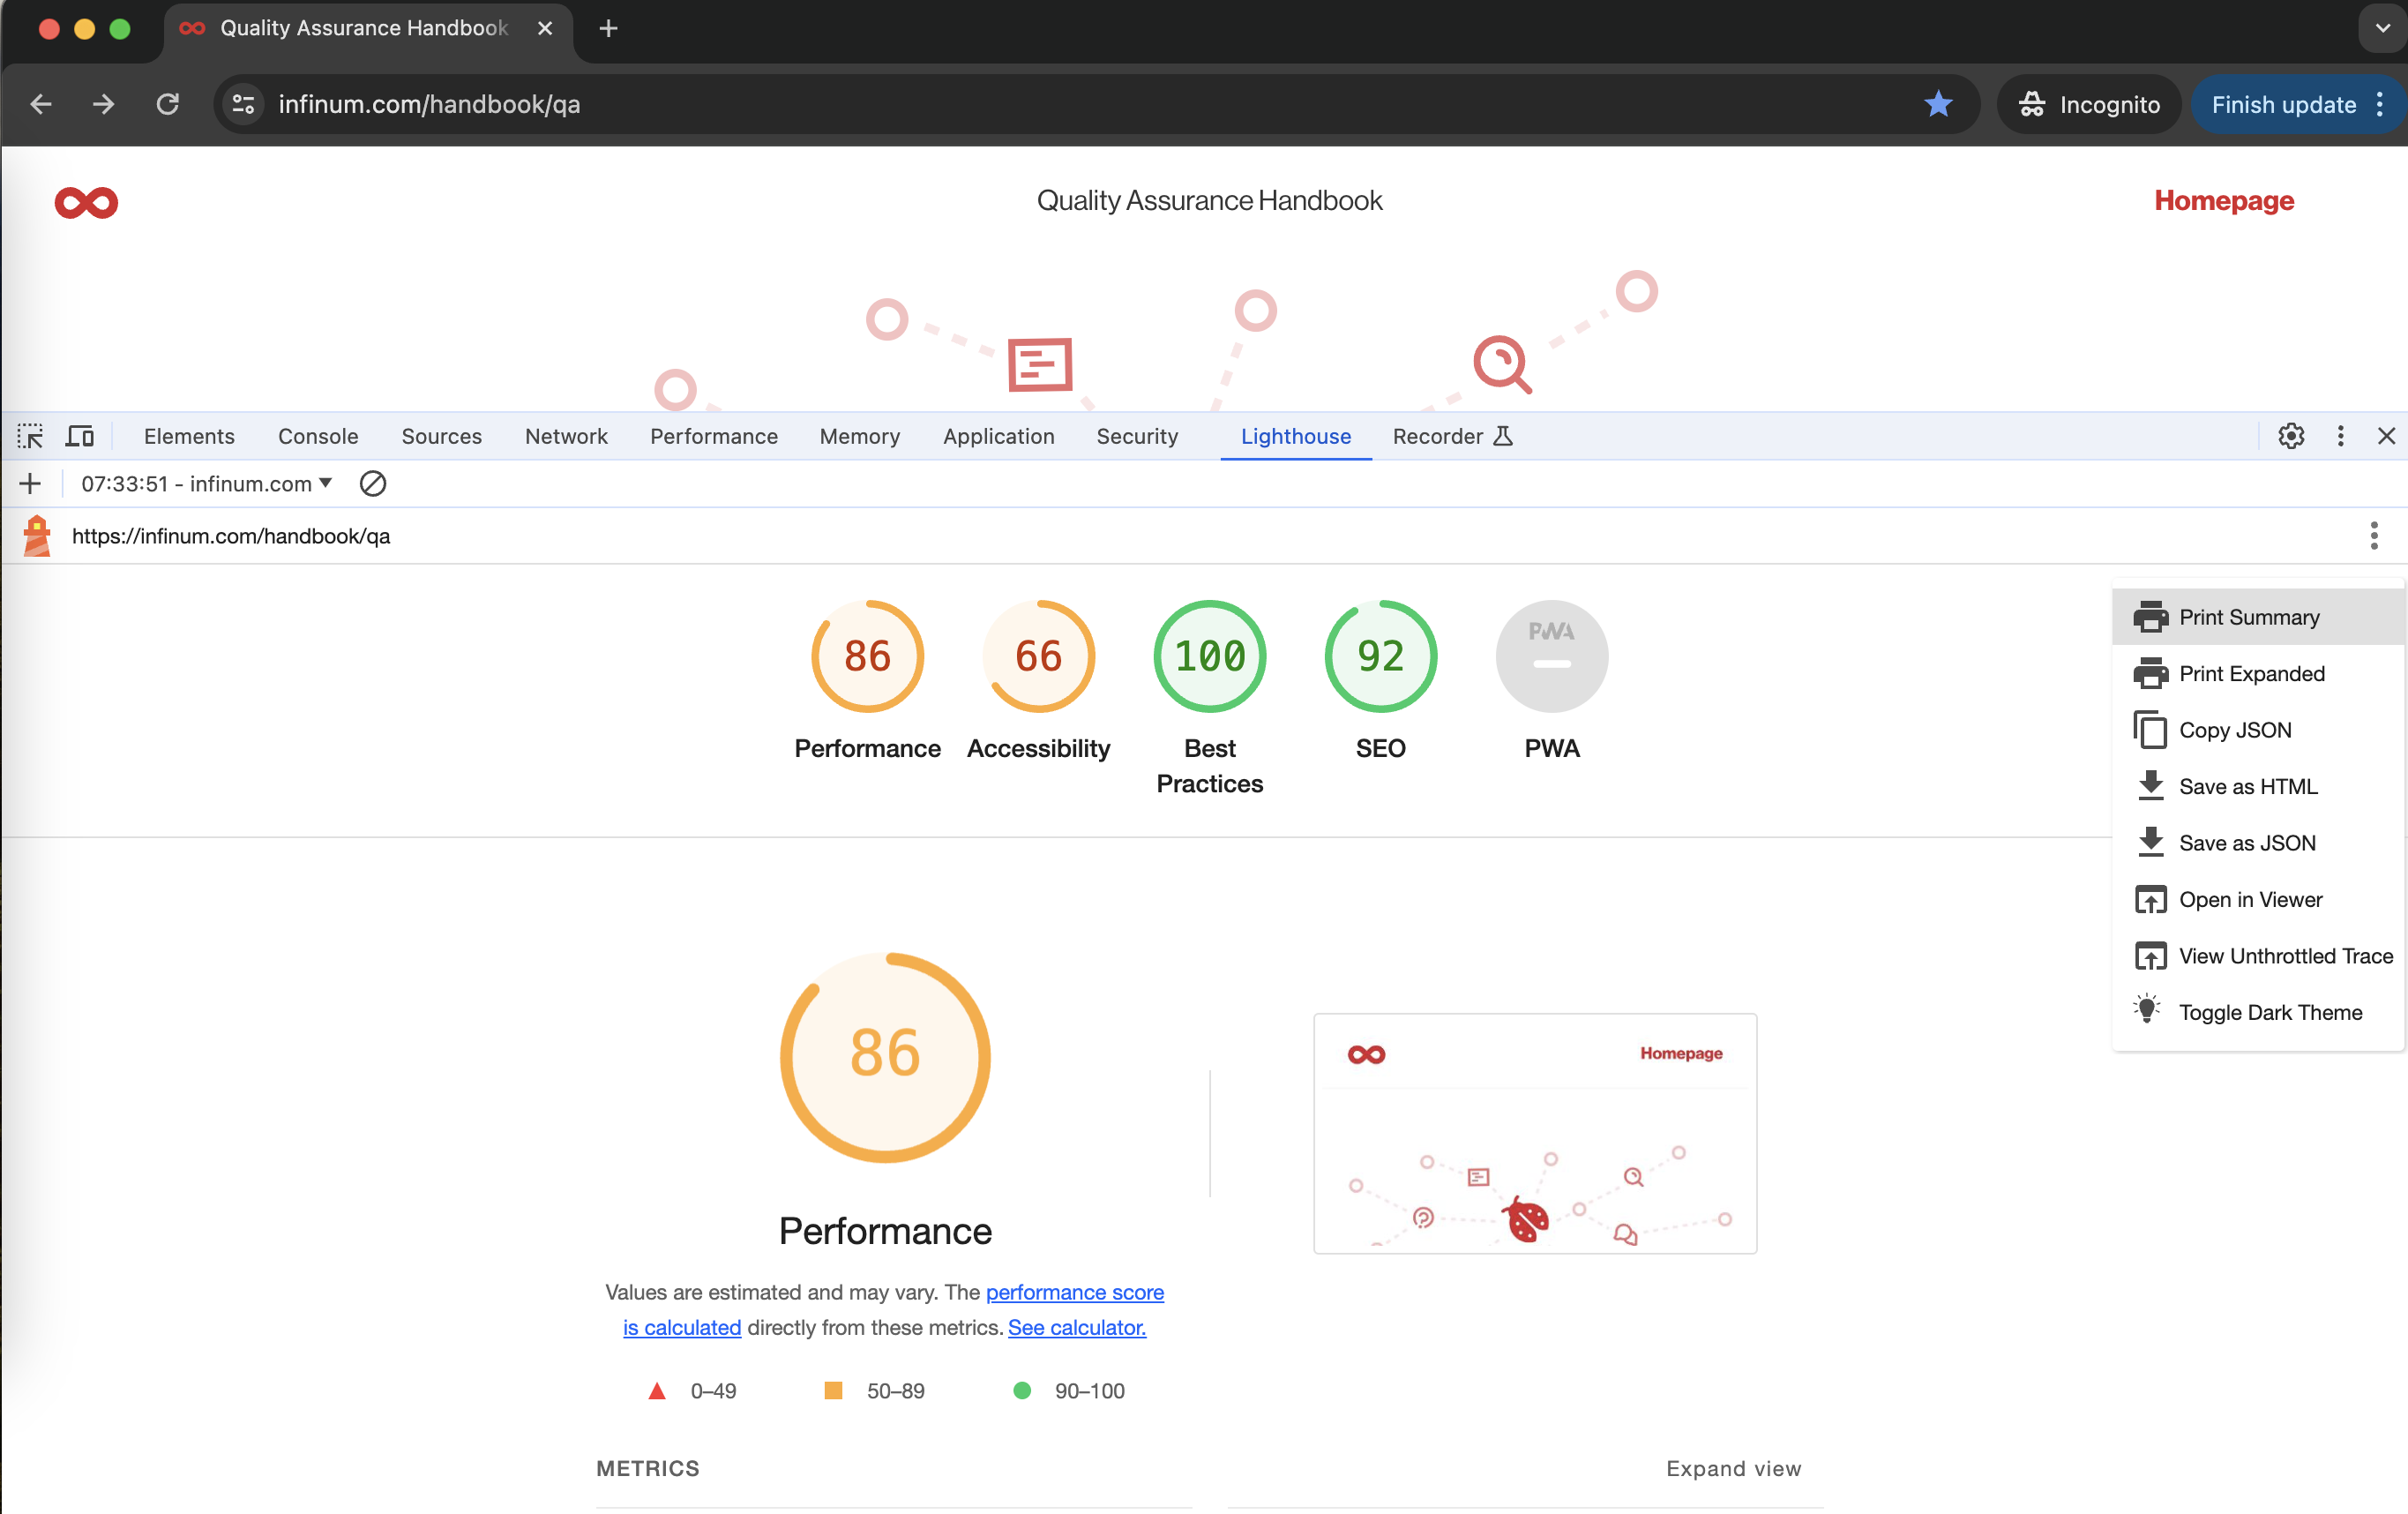
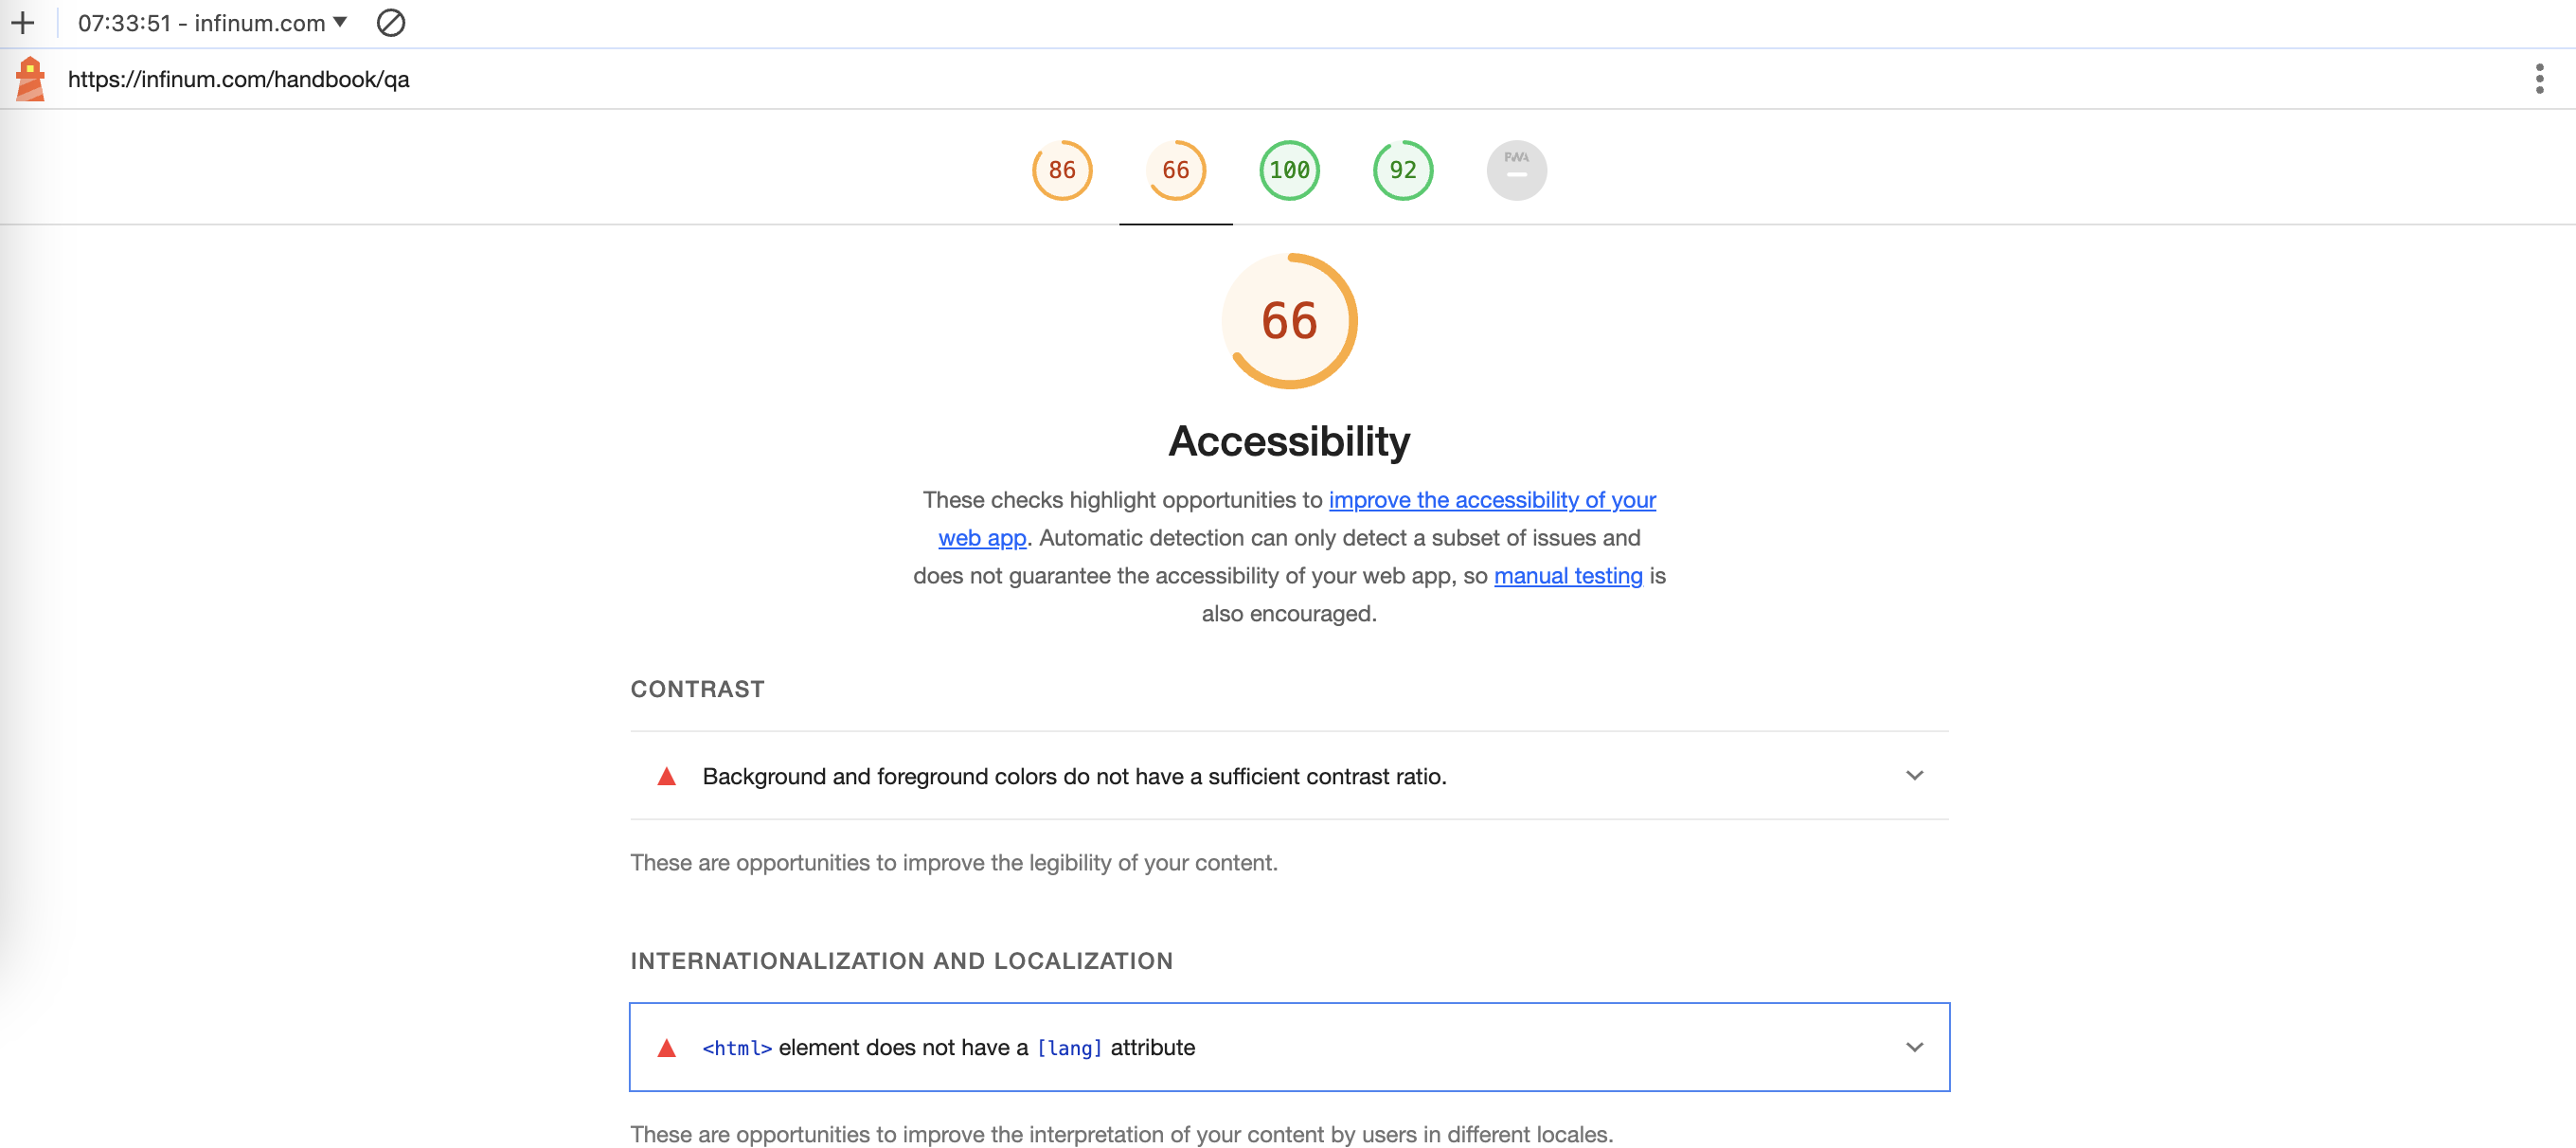
For each aspect you will get a diagnostics report with a score and some insights on how to improve your web app. Scores are calculated from metrics and can be in the range 0-100. Looking at the Diagnostics you can identify things that can be changed to improve specific aspects of the tested web app. When it comes to Performance, you can see if some heavy-loading images are causing the web app to load slowly (Largest Contentful Paint element) or some other suggestions that can lead to potential savings in timing. Similarly, you can detect potential accessibility issues and address them to improve web apps and make them usable by people with disabilities.
Metrics from Lighthouse reports are used in Google rankings as well, so having a good Lighthouse score can be helpful to rank your web page higher.
When you create a report take some time, go through it, and analyze it a bit. Share your findings, both the good ones and the bad ones with the rest of the project team. Engage the rest of the team and drive the initiative to resolve the not-so-good findings from the report. That can result in (for example):
- opening a bug report
- opening an improvement task
Make sure to re-run the tool after those bugs and improvements have been addressed.
Last but not least, if the report is good - make sure to use that as an opportunity to "brag" and commendate your project team both to the rest of your team members, but also to the client as well. As stated above, metrics from the Lighthouse reports are used in Google rankings so a good Lighthouse score is a testament to the extra mile we are prepared to go for our clients.
How to clear cache, cookies, session and local storage
Pages are cached in every browser. The main reason for that is that the operating system keeps a page cache in order to save the memory(RAM) and improve device and page performance.
Note: Emptying cache is very important during testing process cause new changes pushed to staging won't be visible on page that you are testing.
There are few ways on how to clear the cache:
- the easiest way is right click on refresh icon in browser choose Empty cache and hard reload
- second easy way is to open a private tab in browser
Clear local storage:
- right click and run inspector
- choose applications panel
- expand local storage folder
- right click on content in this folders
- click clear and storage will be deleted
Clear session storage:
- right click and run inspector
- choose applications panel
- expand session storage folder
- right click on content in this folders
- click clear and storage will be deleted
Clear cookies:
- right click and run inspector
- choose applications panel
- expand cookie folder
- right click on content in this folder
- click clear and storage will be deleted