Introduction
Card sorting serves as a hands-on tool for understanding the user's mental model, directly informing the development of a website's or application's information architecture by revealing how users naturally group and categorize content.
You can use card sorting to:
- Build your product’s information architecture
- Evaluate your product’s information architecture
- Get inspiration for labeling and grouping content or ideas
Three types of Card Sorting
There are three types of card sorting:
- Open Card Sorting: Participants create their own categories. Excellent for an early-stage project where you're figuring out the basic structure.
- Closed Card Sorting: Participants sort cards into predefined categories. Useful for tweaking or validating an existing structure.
- Hybrid Card Sorting: A combination of open and closed. Allows for the most flexibility and is particularly useful when working with complex interfaces.
How to conduct a Card Sorting session
During the study, participants are given cards, each containing a topic or feature, and asked to group them into categories. This can be done using actual cards, virtual post-it notes, or you can just use Useberry. Whichever tool you are using,
When it comes to the number of participants you will need to recruit, the type of card sorting you choose makes a significant difference. Closed card sorting tends to be more quantitative. To make your data statistically meaningful, you'll need a more substantial participant pool—think at least 30 people to give you numbers you can really crunch. On the other hand, open card sorting is more qualitative and you can get by with fewer participants. A group of 6 or more can provide rich, detailed insights that can help you understand their mental models.
Choosing between open (qualitative) and closed (quantitative) card sorting isn't the only fork in the road; you'll also need to decide whether to go the moderated or unmoderated route. Here's a quick guide to make that choice a bit easier.
If you're leaning towards open card sorting and have the time and resources, consider moderating the sessions to dig deeper into users' thought processes. Short on time? Simply send out the link and add a follow-up question asking participants to explain their reasoning and any dilemmas they faced.
For closed card sorting, if your time and budget allow, moderate a couple of sessions—say, about 5 to 7—and send the link for the rest. If you're stretched with time and budget, send the link with the follow-up question to all participants.
Data analysis
Begin your card sort analysis with a bird's-eye view of the collected data. Take a moment to scan through the categories and choices. What grabs your attention? Is the user's mental model similar to what you have expected to see? What comes as a surprise? Do you see any patterns?
If you've gone the quantitative route, you're likely looking at a decent-sized dataset. In Useberry, you will see the agreement rate (percentage of users who placed a card in a certain category) and similarity matrix (overview of how often two different cards were put in the same category) as primary visualization of the results. They are crucial tools in designing your information architecture and are pretty straightforward at identifying the most common groups and belonging items.
On the other hand, the open card sorting results are not that straightforward. It can be challenging because every participant has their own way of categorizing and labeling content. You will end up with a variety of unique structures and labels. While Useberry will auto-merge some categories, you'll be doing a fair bit of manual merging (standardization, as they call it) too. Some will be no-brainers, like combining "bills" with "payments," but others will require a bit of, well, educated guesswork. Once you clean the data and merge the similar categories together take a look at the agreement rate and similarity matrix. These metrics will guide you, just as they do in closed sorts.
Bear in mind, that Useberry has some limitations when analyzing more complex information architecture structures (the ones that have 3 or more levels). In this case, you would need to use Optimal Workshop (ETR toolstack) or export the csv file from Useberry and use Python or R to plot a dendrogram. Don’t run away before you even start, we did a few times before and you would only need to do it if you are reviewing a more complext information architecture (e.g. the whole app). Ping us in the internal channel, and we’ll lend you a hand.
Card sorting tips & tricks
- Pre-test Your Cards: Before the main event, run a quick test with a few colleagues to make sure the terms on the cards are clear and understandable.
- Limit the Number of Cards: Too many cards can overwhelm participants. Aim for not more than 30-40 cards, depending on the complexity of the information.
- Use Clear and Concise Labels: Avoid ambiguity; the terms you use should be easily understood.
- Randomize Card Order: When presenting cards to participants, randomize their order to prevent any bias.
- Encourage Thinking Aloud: In moderated sessions, ask participants to verbalize their thought process. This can provide invaluable insights.
- Quick Debrief: A short conversation or a follow-up question post-sort can get you insights that might not be evident from the sorting data alone.
Tree testing
Intro
Tree testing, also known as reverse card sorting, is a method used in user research to evaluate the effectiveness of a website's navigation structure. It is a way to test how well users can find information within a website by testing their ability to locate specific pages within a website's proposed navigation structure.
Execution
To prepare for a tree test, you might have to create a sitemap of the software’s proposed navigation structure. The sitemap should include pages of the software you want to test, organized into a hierarchical structure. Designers and QA experts can help you outline the structure.
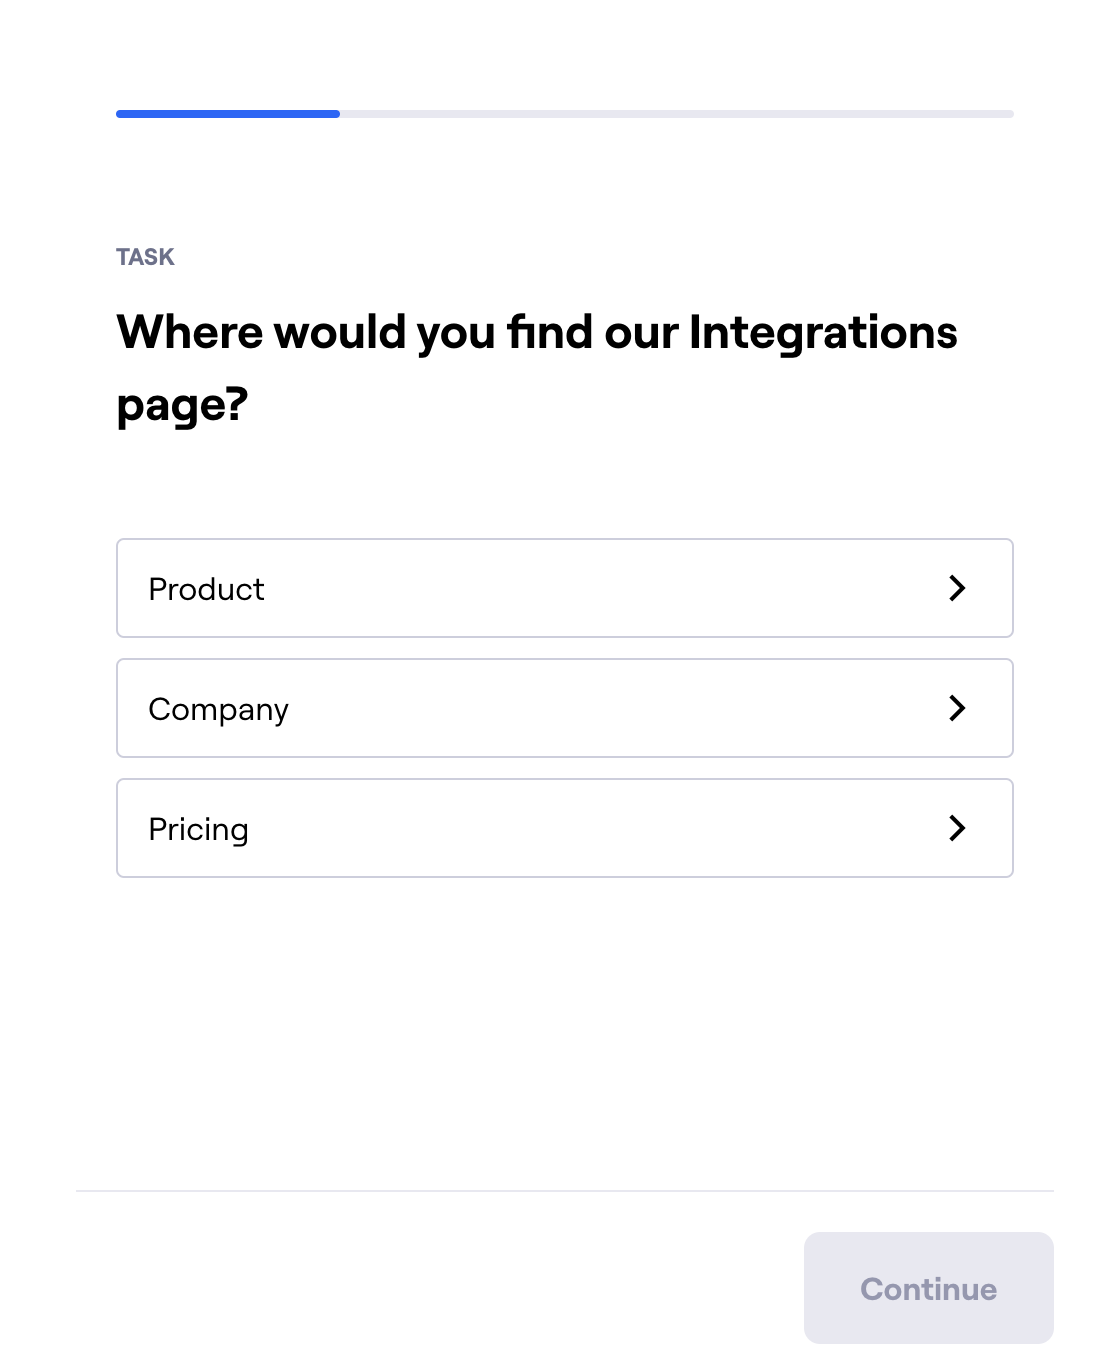
In a tree test, participants are presented with a website's proposed navigation structure, usually in the form of a sitemap, and asked to find specific pages within the structure.
Tree testing tasks should be written from a user perspective. Their goal should match user needs and objectives and be representative of the types of tasks that users would typically perform on the website.
Tree testing can be part of the usability testing study. You can use Useberry to conduct it.
Useberry doesn’t tell participants if they found the correct part of the app. So after each task, ask them how sure they are that they found it and how easy it was to find it.
Data Analysis
The data collected from the tree test can be analyzed to identify patterns and trends. Look for patterns in the data that may indicate issues with the overall navigation structure. For example, if many participants have difficulty finding specific pages, it may indicate that the navigation structure is not intuitive or that the labels used are not clear. Longer time taken to complete the task can also be a sign of an issue.
By identifying these issues, you can make recommendations for improvements to the navigation structure to make it more user-friendly.