Performance isn’t just about what happens in the browser - it also depends on how efficiently our servers handle requests and generate responses. At Infinum, we've chosen K6 as the default tool for server side performance testing.
Why K6?
We have chosen K6 for our server-side performance tests for following reasons:
- Developer-Friendly
- Written in JavaScript, so frontend and Node.js developers can easily create test scripts.
- Simple, readable test scripts without heavy configuration files.
- Lightweight & Fast
- Designed to handle high loads with minimal overhead.
- Command-line interface that gives real-time metrics and can fail fast when thresholds aren’t met.
- Great for CI/CD Integration
- Can be run in Docker containers or integrated directly into pipelines (e.g., GitHub Actions, GitLab CI).
- Supports pass/fail thresholds, making automated testing straightforward.
- Rich Metrics & Thresholds
- Built-in metrics for response times (including percentiles), error rates, and more.
- Define success criteria with thresholds - if performance dips below expectations, tests can fail automatically.
K6 Functionalities
- JavaScript Test Scripting
- Tests are written in JS/ES6 modules.
- Import
httpfor requests,checkfor assertions, and other built-in modules to handle data, metrics, etc.
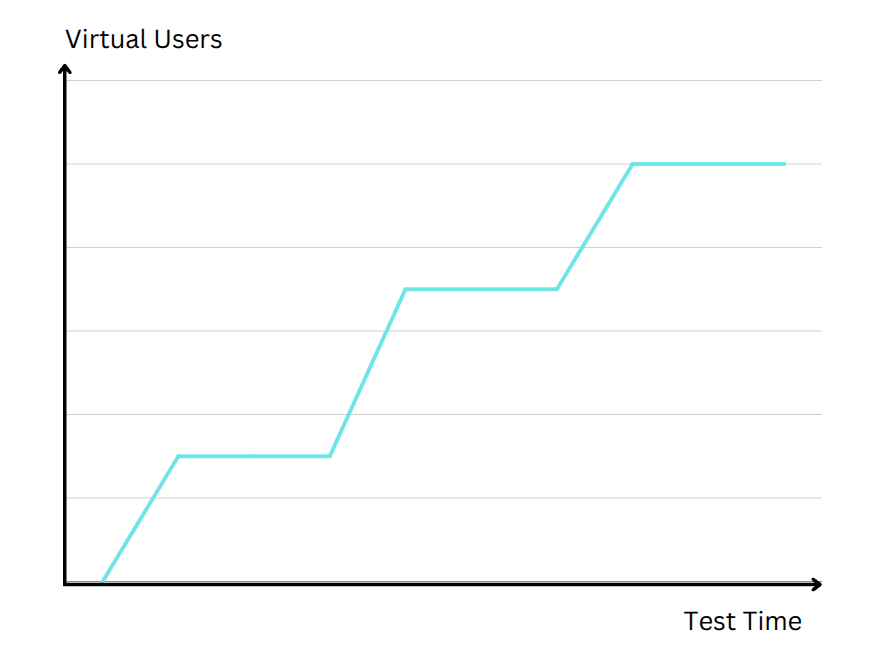
- Scenarios & Stages
- K6 supports scenarios where you can define different traffic patterns.
- Stages allow you to ramp Virtual Users (VUs) up or down, hold for a certain duration, and then ramp down.
- Thresholds
- A powerful feature letting you specify performance goals in your script.
- Example:
http_req_duration: ['p(95)<500']ensures 95% of requests are under 500ms.
- Metrics & Logging
- K6 automatically tracks metrics like request duration, error rates, iterations, etc.
- You can also create custom metrics for specific logic in your test.
- Docker Integration
- Official Docker image grafana/k6 makes it easy to run tests in a container.
- Helpful for ensuring consistency in both local and CI environments.
- Extensions & Libraries
- K6 has a growing ecosystem of extensions (e.g., for
gRPCtesting, data stores). - You can also pull in external libraries for advanced scenarios, though keep in mind K6 runs on a specialized JS runtime Goja.
- K6 has a growing ecosystem of extensions (e.g., for
Quick Start
Below is a minimal example of how to set up and run a simple load test your Next.js application using K6 in a Docker Compose environment. This is just a starting point, production setups might require more configuration.
Also, keep in mind that your Next.js app should be running in a Docker container with production ready type build.
Project Structure
In your application root directory create k6 folder, and recreate following structure inside it:
(root)
    └── k6
        ├── docker-compose.yml
        ├── README.md
        └── scripts
            └── example.js
docker-compose.yml: Defines the K6 service.example.js: Contains the K6 script.README.md: (Optional) Document usage or test details.
Example script
// (root)/k6/scripts/example.js

import http from 'k6/http';
import { check } from 'k6';

// Replace with your own test URL
const TEST_URL = 'https://infinum.com';

export let options = {
  scenarios: {
    soak_test: {
      executor: 'ramping-vus',
      startVUs: 1,
      stages: [
        { target: 100, duration: '10m' }, // Ramp up to 100 users in 10 minutes
        { target: 100, duration: '5h' }, // Stay at 100 users for 5 hours
        { target: 1, duration: '10m' }, // Ramp down to 1 user in 10 minutes
      ],
      maxVUs: 100,
    },
  },
};

// Main test function: performs a GET request and checks that the response status is 200.
export default function () {
  const response = http.get(TEST_URL, {
    headers: { Accept: 'application/json' },
  });
  check(response, { 'status is 200': (r) => r.status === 200 });
}
Docker compose
# (root)/k6/docker-compose.yml

services:
  k6:
    image: grafana/k6:latest
    network_mode: host
    volumes:
      - ./scripts:/scripts
Reading Next.js app resources consumption
In order to find your Next.js app container ID, run following command:
docker container ls --format "table {{.ID}}\t{{.Image}}\t{{.Names}}"
Copy the CONTAINER ID of your app, and run following command in terminal:
docker stats {CONTAINER_ID}
The docker stats command provides real-time resource usage statistics for running containers. You want to have the stats display in the background while running K6 tests. Here's a breakdown of example output parameters:
- CONTAINER ID
18c1d97a2f8c→ The unique ID of the running container.
- NAME
next-app→ The human-readable name of the container.
- CPU %
5.00%→ The percentage of the host’s CPU currently being used by the container.- If it reaches 100%, it means the container is using a full CPU core.
- If you have multiple cores, the value can exceed 100% (e.g., 200% on a dual-core CPU).
- MEM USAGE / LIMIT
48.45MiB / 61.92GiB48.45MiB→ The current memory being used by the container.61.92GiB→ The maximum memory available to the container (if no limit is set, it defaults to the host’s total memory).
- MEM %
0.08%→ The percentage of the total available memory being used by the container.- Calculated as:
(MEM_USAGE / MEM_LIMIT) x 100
- NET I/O
- This measures network activity (download/upload).
326kB / 0B326kB→ Data received by the container.0B→ Data sent from the container.
- BLOCK I/O
- This is useful for monitoring disk activity.
95.6MB / 836kB95.6MB→ Data written to disk by the container.836kB→ Data read from disk.
- PIDS (Processes)
- Useful for checking if a container has too many or too few processes running.
8→ The number of processes currently running inside the container.
Running the Test
- Run the
docker statscommand for your Next.js app. - Open your terminal in the
(root)/k6folder. - Run
docker compose run --rm k6 run /scripts/example.js- this will run theexample.jsscript inside K6 container. - During the test, you'll see progress / real-time updates.
- Once the test finishes, you’ll see a summary of metrics.
Reading K6 output
During the test
While the test runs, you’ll see a progress bar or periodic summary lines with metrics like:
- VU (virtual users) count (how many are currently active)
- Iterations (how many total script iterations have run)
- Requests/Second (current throughput)
- Failures or errors encountered
This allows you to monitor the test in real time, especially important if you need to stop or modify the test if unexpected behavior occurs (e.g., the server starts failing rapidly).
After the test
After the test completes, K6 prints a detailed report:
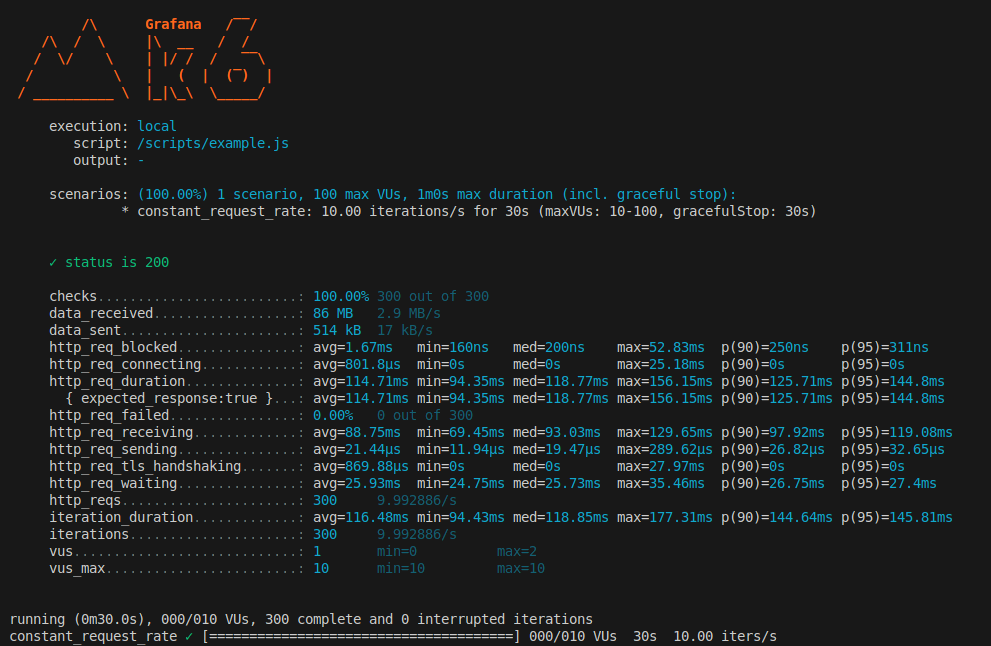
In this test, we evaluated Infinum website, which is statically generated. While the site itself does not rely on server-side rendering (SSR), we can still analyze the key performance metrics and explain their relevance for SSR applications.
Below is a breakdown of each metric, detailing its significance and how it applies to server-rendered applications.
checks- The number and rate of checks passing or failing. A “check” is a validation in your script - for example, ensuring the response code is 200 or verifying specific content on the page.
- In the example,
100.00% 300 out of 300means all 300 checks passed successfully (no failures). - A way to confirm that responses contain the correct data, not just that they came back in time.
- Helps ensure that your rendered pages contain expected content. If checks fail, it may indicate rendering errors or partial SSR failures.
data_received- The total amount of data received from the server during the test and the average rate (
MB/sorKB/s). - In the example,
86 MB 2.9 MB/sindicates the test downloaded a total of86 MBat~2.9 MB/son average. - Shows how large your responses are overall. For SSR, large HTML payloads or big static assets can increase this.
- If unusually high, consider compression or reducing your rendered content size.
- The total amount of data received from the server during the test and the average rate (
data_sent- The total amount of data sent to the server by K6 and the average rate (MB/s or KB/s).
- In the example,
514 kB 17 kB/sindicates the client sent half a megabyte of data, averaging17 kB/s. - If your test includes POST or PUT requests with large request bodies, this can grow.
- Normally small for basic
GETrequests in SSR scenarios.
http_req_blocked- The time a request spent in the blocked state before sending. This can include DNS lookups, connection limits, or time waiting for a TCP socket to become available.
- In the example, the
max=52.83msmight be from a delayed TCP connection or DNS resolution. - High values can indicate network / DNS issues, or local resource limits on connections.
- For SSR, if you see big spikes, it could add to overall response time, but is often overshadowed by actual rendering time.
http_req_connecting- The time spent establishing a TCP connection. This is a subset of
http_req_blocked. - High
maxcan indicate occasional network hiccups or ephemeral port exhaustion. - Not typically the main factor in SSR performance, but if extremely high, it can add noticeable delay.
- The time spent establishing a TCP connection. This is a subset of
http_req_duration- The total time spent from sending the request to receiving the final byte of the response.
- One of the most important metrics for SSR because it includes server-side rendering time + network latency + time to receive all data.
- In the example, an average around
~115msmight be acceptable, but thep95near145msindicates slower requests exist. - If these numbers get high (e.g.,
500ms+), users experience slower initial page loads.
{ expected_response:true }- This line indicates the subset of requests that matched a specific tag (in K6 scripts, you can categorize requests).
- In the example, the stats are the same as the overall
http_req_duration, meaning all requests were presumably “expected” responses.
http_req_failed- The percentage (or fraction) of failed requests (4xx/5xx status codes or network errors).
- It indicates whether your service is stable under load. If the error rate spikes under certain concurrency, you’re hitting a bottleneck.
- A rising failure rate might mean your SSR service (or its dependencies, e.g., databases) cannot handle the load, causing timeouts or internal errors.
http_req_receiving- The time spent receiving the response body from the server, after the first byte is received.
- For SSR pages, large chunks of HTML or significant data in the response can inflate this.
- Compare with
http_req_waitingto see if the bottleneck is in server processing or data transfer.
http_req_sending- The time spent sending the request to the server.
- Large values appear if the request body is big or if there’s a network bottleneck.
- SSR apps typically doesn’t have large request bodies unless you’re POSTing data.
http_req_tls_handshaking- Time spent performing
TLS/SSLhandshakes. - If your app runs over HTTPS (production scenario), this is the overhead for secure connections.
- Typically small, but spikes (e.g.,
27.97msin the example) might happen with certain requests or if the environment re-establishes TLS frequently.
- Time spent performing
http_req_waiting(a.k.a. “Time to First Byte” or TTFB)- The time from when the request was sent until the first byte of the response is received (i.e., how long the server took to start sending data).
- Extremely relevant for SSR because TTFB includes server render time. This is often the single biggest indicator of SSR performance issues - if TTFB is high, the user sees a blank page for longer.
- In the example,
~26msis actually quite fast. Notice that it’s significantly lower than the totalhttp_req_duration, meaning most of the time is spent receiving the rest of the response (http_req_receiving). - If TTFB is high, investigate server-side data fetching, CPU usage, or any heavy computation during SSR.
http_reqs- The total count of HTTP requests made during the test.
- Shows how many requests your application had to handle. In an SSR Next.js context, each page request often triggers SSR logic on the server, so the total request count is how many times your server performed SSR.
iteration_duration- The time (avg, min, med, max) for each iteration to complete. An iteration often includes multiple requests and script logic.
- If your default function does multiple steps (like logging in, then fetching a page),
iteration_durationis the total time per VU iteration. - Helps correlate how long each user’s “journey” takes.
iterations- The total number of test script iterations run by all Virtual Users (VUs).
- Each iteration typically represents a single run of the default function. If your default function includes multiple HTTP calls, each iteration can yield multiple requests. This helps you track high-level test progress.
vus- Current active Virtual Users (VUs) at the time the metrics were captured.
- Important for load/stress tests. The number of VUs directly impacts concurrency.
vus_max- The maximum number of allocated VUs that K6 could spin up during the test.
Some of the metrics also contain following details:
avg(Average): The mean response time across all requests. Can be skewed if there are few extremely slow or extremely fast requests.min: Fastest request time.med(Median): Half of your requests are faster than this, half are slower.max: Slowest request time.p(90),p(95),p(99): The response time at the 90th, 95th, or 99th percentile. For example,p(95)=750msmeans 95% of requests completed in 750ms or less, and 5% took longer.
Most Important Metrics for SSR (Next.js)
While all of the above metrics can be important, these are particularly critical for a server-rendered Next.js application:
- Time to First Byte (TTFB)
- Directly reflects how quickly the server can render the initial HTML.
- A major factor in user-perceived performance: users see a blank screen until TTFB completes.
95th/99thPercentile Response Time (p95/p99ofhttp_req_duration)- Captures “worst-case” scenarios or how slow the site can be for a significant minority of users.
- SSR can exhibit high tail latencies if some data fetching is slow or the server is overloaded.
http_req_receiving- Can reveal if the SSR HTML or data payload is large, which can slow the user from fully loading the page.- Request Throughput (
http_reqs) - SSR is CPU-bound more than static file serving. Knowing how many pages you can serve per second helps capacity planning. - Error Rate (
http_req_failed) - Confirm whether the server or backend dependencies fail under certain loads.
When combined with server-side metrics (CPU, memory, logs), these K6 outputs give a comprehensive view of whether your SSR application scales efficiently and maintains performance for end-users.
Difference between VUs and Arrival Rate
In K6, you can define your test load in two ways: by specifying Virtual Users (VUs) or by setting an arrival rate.
VUs
When you use VUs, you’re simulating a certain number of concurrent “users” running your script at the same time. For example, you might ramp up from 1 to 50 VUs, once a VU finishes all the steps in your script, including any sleeps you’ve coded - it immediately starts the next iteration. This approach helps you understand how your system behaves under a given level of concurrency - ideal if you’re focused on how many people can simultaneously interact with your site.
Arrival Rate
In contrast, arrival rate focuses on requests per second (or iterations per second). You might tell K6 to generate 100 new requests every second, and it will spin up as many VUs as needed to maintain that rate. This method is useful if you know your expected traffic pattern in terms of throughput, but it offers less direct control over how many users are active at once. If your project has defined an SLA that states, for example, "Our service must handle 500 requests per second while keeping response times under 300ms." then focusing on RPS (requests per second) is often the best way to test against that requirement.
Different types of performance tests
In server-side performance testing, we typically run one or more of the following test types. Each uncovers unique insights into how our application behaves under different load profiles.
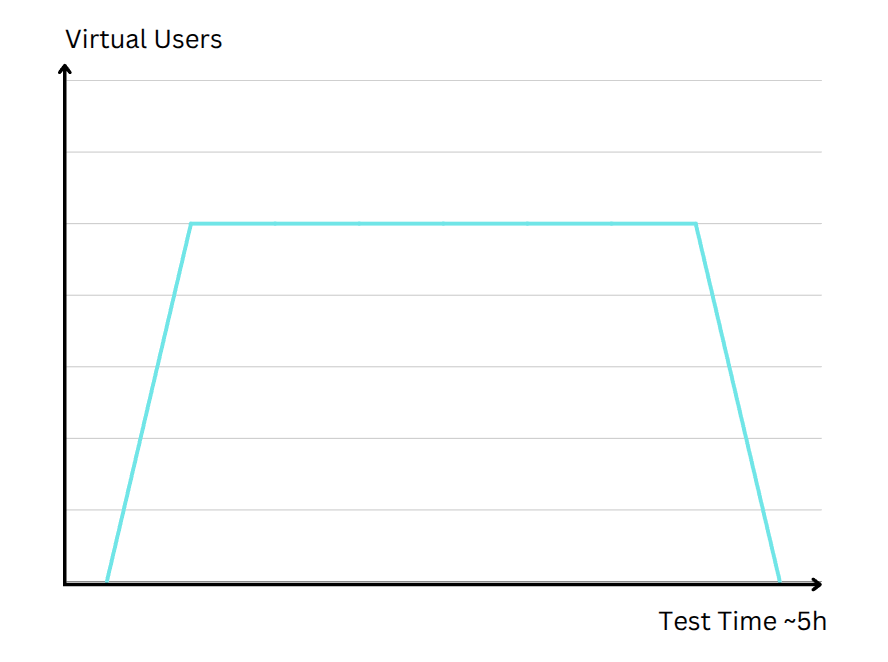
Load Testing
Load testing is about verifying whether an application can comfortably handle the level of traffic you normally expect, or slightly above it. Imagine you run an online store that typically sees 1,000 concurrent users during peak hours. A load test would mimic this traffic profile, gradually ramping up virtual users until you reach that level, then sustaining it for a reasonable duration. You’d be looking at metrics like average response time, error rates, and resource utilization to ensure everything remains stable under these regular load conditions. If performance degrades (e.g., page response times spike or error rates increase) before reaching your known peak, the load test reveals potential bottlenecks that need attention.
  // Load Testing: Ramping VUs
  load_test: {
    executor: 'ramping-vus',
    startVUs: 1,
    stages: [
      { target: 50, duration: '10m' }, // Ramp up to 50 users in 10 minutes
      { target: 50, duration: '40m' }, // Stay at 50 users for 40 minutes
      { target: 1, duration: '10m' }, // Ramp down to 1 user in 10 minutes
    ],
    maxVUs: 50,
  },
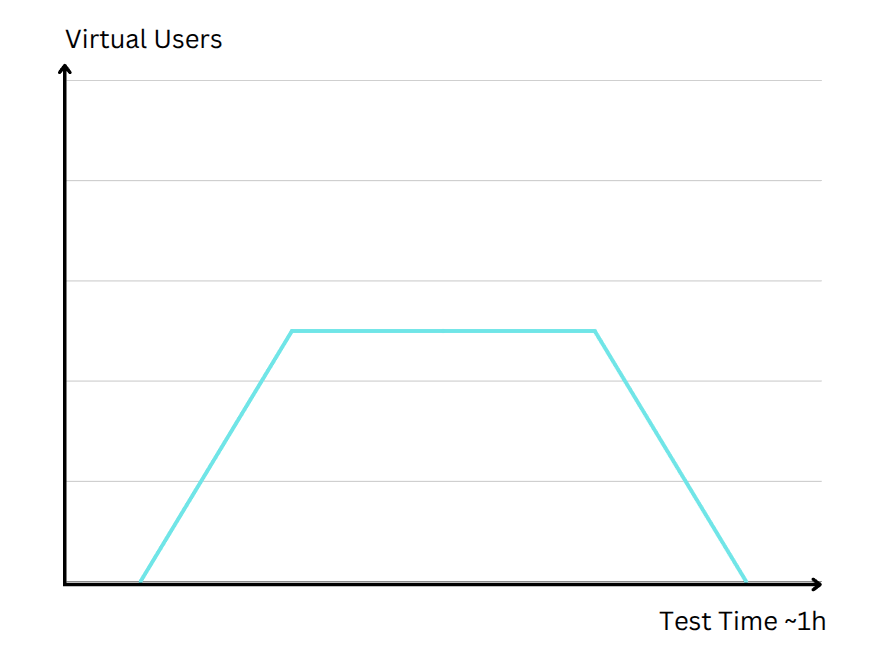
Soak (Endurance) Testing
While a load test might only run for a few minutes, a soak test extends that duration to multiple hours or even days. The focus here is on identifying issues that accumulate over time. For example, a small memory leak in a server-side application might not be noticeable in a short test, but over several hours of steady traffic, it can lead to crashes or severe slowdowns. In a soak test, the load level might resemble what you see in real-world daily or weekly usage patterns, but the length of the test uncovers hidden resource leaks, database connection saturation, or other stability concerns that only manifest with prolonged stress. For real-world examples of issues detected through soak testing, refer to the Caching and revalidation chapter.
  // Soak Testing: Long Duration Test
  soak_test: {
    executor: 'ramping-vus',
    startVUs: 1,
    stages: [
      { target: 50, duration: '10m' }, // Ramp up to 50 users in 10 minutes
      { target: 50, duration: '5h' }, // Stay at 50 users for 5 hours
      { target: 1, duration: '10m' }, // Ramp down to 1 user in 10 minutes
    ],
    maxVUs: 50,
  },
Spike Testing
Not all traffic ramps up predictably. Sometimes, your site might receive a sudden influx of visitors - think of a social media post going viral or a limited-time sale starting at a specific moment. Spike testing simulates these abrupt surges. Instead of a gradual increase, the test instantly jumps from a low number of concurrent users to a very high number. The key question is: How quickly does your system adapt? If it can scale rapidly or degrade gracefully without crashing, you pass a spike test. If your response times or error rates skyrocket under the sudden onslaught, it highlights areas that need more robust handling - perhaps better load balancing, caching strategies, or auto-scaling configurations.
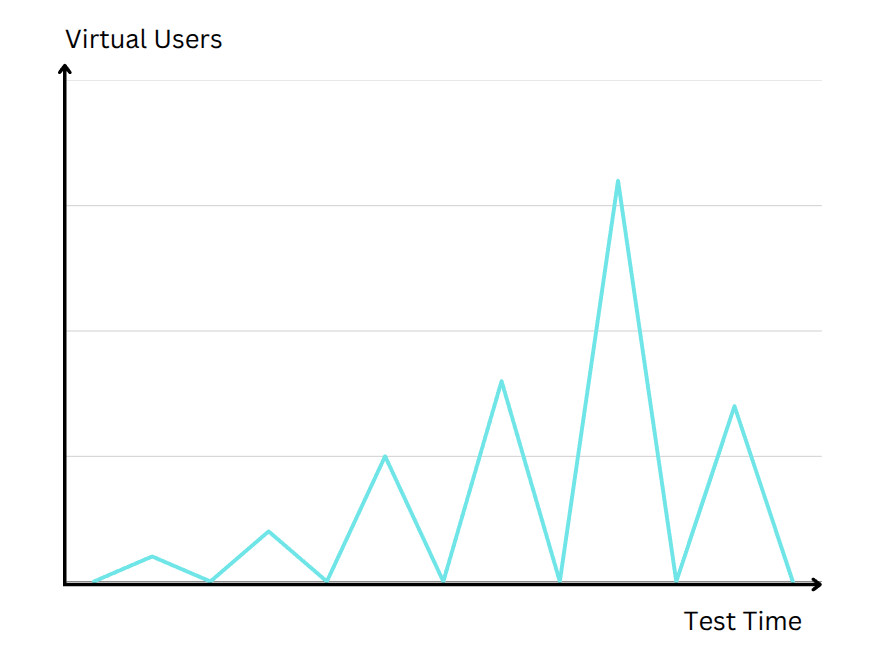
  // Spike Testing: Sudden Load Spikes
  spike_test: {
    executor: 'ramping-arrival-rate',
    timeUnit: '1s',
    startRate: 10,
    stages: [
      { target: 50, duration: '10s' }, // Go from 10 to 50 users in 10 seconds
      { target: 0, duration: '10s' }, // Return to 0 users in 10 seconds
      { target: 80, duration: '10s' }, // Go from 0 to 80 users in 10 seconds
      { target: 10, duration: '10s' }, // Return to 10 users in 10 seconds
      { target: 120, duration: '10s' }, // Go from 10 to 120 users in 10 seconds
      { target: 20, duration: '10s' }, // Return to 20 users in 10 seconds
      { target: 180, duration: '10s' }, // Go from 20 to 180 users in 10 seconds
      { target: 20, duration: '10s' }, // Return to 20 users in 10 seconds
    ],
    preAllocatedVUs: 300,
    maxVUs: 1000,
  },
Stress Testing
Where a load test aims to stay at or near expected user volumes, a stress test actively pushes the system beyond its normal limits to find the breaking point. The purpose here is to see how and where your application fails. Does it slow down progressively, or return more errors as usage grows? Maybe it suddenly crash once a certain resource is exhausted? Stress testing can reveal the absolute capacity of your infrastructure and how well it recovers once load is reduced. Knowing these limits helps in planning capacity upgrades, especially if you foresee major traffic spikes in the future or want to ensure business continuity for mission-critical services.
  // Stress Testing: Ramping VUs
  stress_test: {
    executor: 'ramping-vus',
    startVUs: 10,
    stages: [
      { target: 100, duration: '30s' }, // Ramp up to 100 users in 30 seconds
      { target: 100, duration: '30s' }, // Stay at 100 users for 30 seconds
      { target: 200, duration: '30s' }, // Ramp up to 200 users in 30 seconds
      { target: 200, duration: '30s' }, // Stay at 200 users for 30 seconds
      { target: 300, duration: '30s' }, // Ramp up to 300 users in 30 seconds
      { target: 300, duration: '30s' }, // Stay at 300 users for 30 seconds
      // ... continue to add more stages as needed
    ],
    maxVUs: 500,
  },
Scalability Testing
Even if you know your system’s current capacity, it’s vital to understand whether you can easily scale to handle more traffic. Scalability testing measures how performance metrics like response times or throughput change as you add or remove resources. You might increase the number of application servers or CPU/RAM allocations to see if you achieve linear performance gains. In many real-world cases, performance plateaus or hits diminishing returns because of architectural bottlenecks. By testing different resource configurations, you pinpoint exactly where your system stops scaling effectively. This knowledge ensures you invest in the right optimizations for future growth.
  // Scalability Testing: Increasing Load
  scalability_test: {
    executor: 'ramping-vus',
    timeUnit: '1s',
    startRate: 10,
    stages: [
      { target: 50, duration: '1m' },
      { target: 100, duration: '1m' },
      { target: 200, duration: '1m' },
      { target: 300, duration: '1m' },
      { target: 400, duration: '1m' },
      { target: 500, duration: '1m' },
      { target: 550, duration: '1m' },
      { target: 580, duration: '1m' },
      { target: 600, duration: '1m' },
      { target: 610, duration: '1m' },
      { target: 615, duration: '1m' },
      // ... continue to add more stages as needed
    ],
    preAllocatedVUs: 500,
    maxVUs: 1000,
  },
Best Practices & Common Pitfalls
Don’t Test Directly on Production:
Hammering your live environment with heavy loads can disrupt real users, inflate costs, or even cause downtime. Instead, use a staging or pre-production environment. If you must test in production, do so off-peak and with strict safeguards.
Use a Representative Environment:
Run performance tests on a setup that mirrors production as closely as possible (same server specs, software configuration, and network topology). This ensures that observed performance matches what you’d expect in real-world usage.
Define Clear Performance Goals & Thresholds:
Set explicit criteria (e.g., “95% of requests under 500ms”) before testing. This helps you decide quickly if performance is acceptable, and it allows automated pass/fail checks in your CI/CD pipeline.
Monitor Both System and Test Tool:
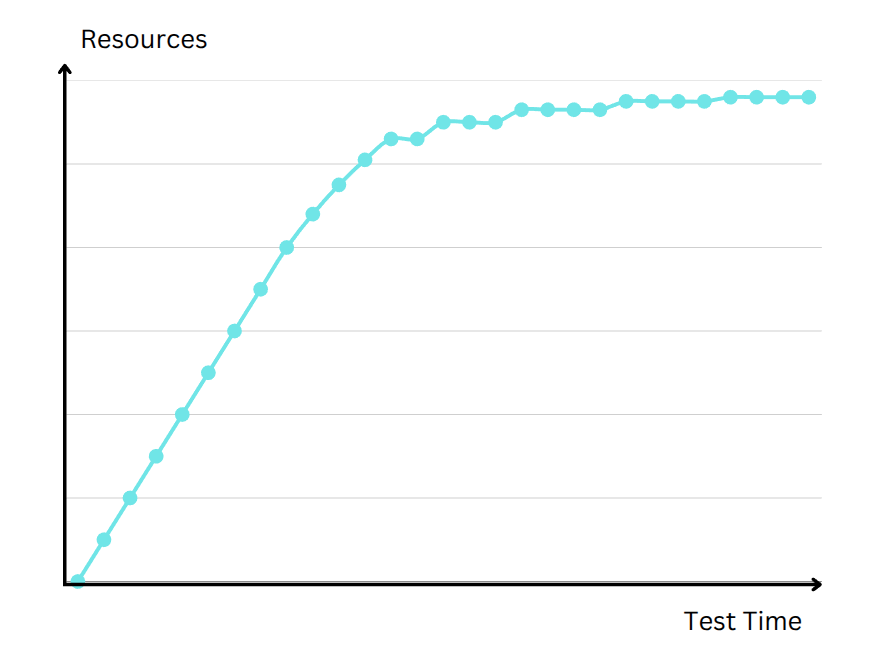
K6 outputs vital metrics, but also watch server resources like CPU, memory and logs. If the server is maxed out, you’ll see performance degrade, even if K6’s request metrics seem fine initially.
Replicate Realistic User Behavior:
Users rarely just slam the same endpoint. Script journeys that mimic real navigation patterns, multi-step flows, or different user roles to uncover problems that simpler tests might miss.
Gradually Increase Load:
Avoid instantly hitting peak concurrency (unless you’re doing a Spike Test). Ramp up in stages to identify the point at which response times or error rates start to climb.
Analyze the Entire Performance Picture:
Look beyond average response times. Check 90th, 95th, or 99th percentile latencies, error rates, and throughput for a more accurate sense of how many users might experience slow or failing requests.
Keep Tests Versioned & Automated:
Store test scripts in the same repo as your code and run them regularly (e.g., post-deployment or locally after dependencies updates). Frequent, automated testing catches regressions early and embeds performance checks into your development cycle.
Watch for Long-Term Effects:
Short tests might not reveal memory leaks or gradual resource exhaustion. Include soak tests (running hours or days) to detect stability issues that only appear under prolonged load.
Don’t Rely Solely on Averages:
A good average can hide tail latencies if a small but significant percentage of requests are very slow. Percentile metrics reveal these outliers.
Have a Plan for the Results:
Running tests without acting on the findings wastes time. Investigate performance bottlenecks, then optimize code, queries, caching, or infrastructure. Retest to confirm improvements.
Collaborate Across Teams:
Siloed knowledge leads to partial fixes. Share test findings with other developers, QA, ops, and product owners to align on priorities and fix performance holistically.
Remember Performance Is Ongoing:
Applications change over time. New features, increased traffic, or different infrastructure can reintroduce bottlenecks. Test regularly to maintain a consistently good user experience.