Note: Since the publishing of this article, the Philips NutriU app has grown in scope and changed its name to HomeID. You can learn more about the project by visiting our work page.
As IoT devices flood our environments with real-time data, building the right pipeline is essential for turning that data into insight. With inputs streaming in from sensors, apps, and external sources, smart data handling is the backbone of every successful IoT system.
As the Internet of Things (IoT) continues to evolve, it has significantly expanded what’s possible in data engineering. By integrating data from sensors, applications, and external sources (like weather forecasts), teams can discover new insights, optimize business processes, and unlock value by providing instant, real-time benefits to end-users.
But with new opportunities also come new challenges. The exponential growth of generated data requires us to think about scalable storage solutions, real-time event processing, and ensuring compatibility of diverse data sources. All of these fall under the domain of computer science, commonly known as data engineering – an area we’ve explored deeply both in theory and in practice.
In this article, we’ll walk through key considerations for setting up a modern IoT data pipeline, drawing on our technical expertise and real-world client projects.
Stream processing vs. batch processing
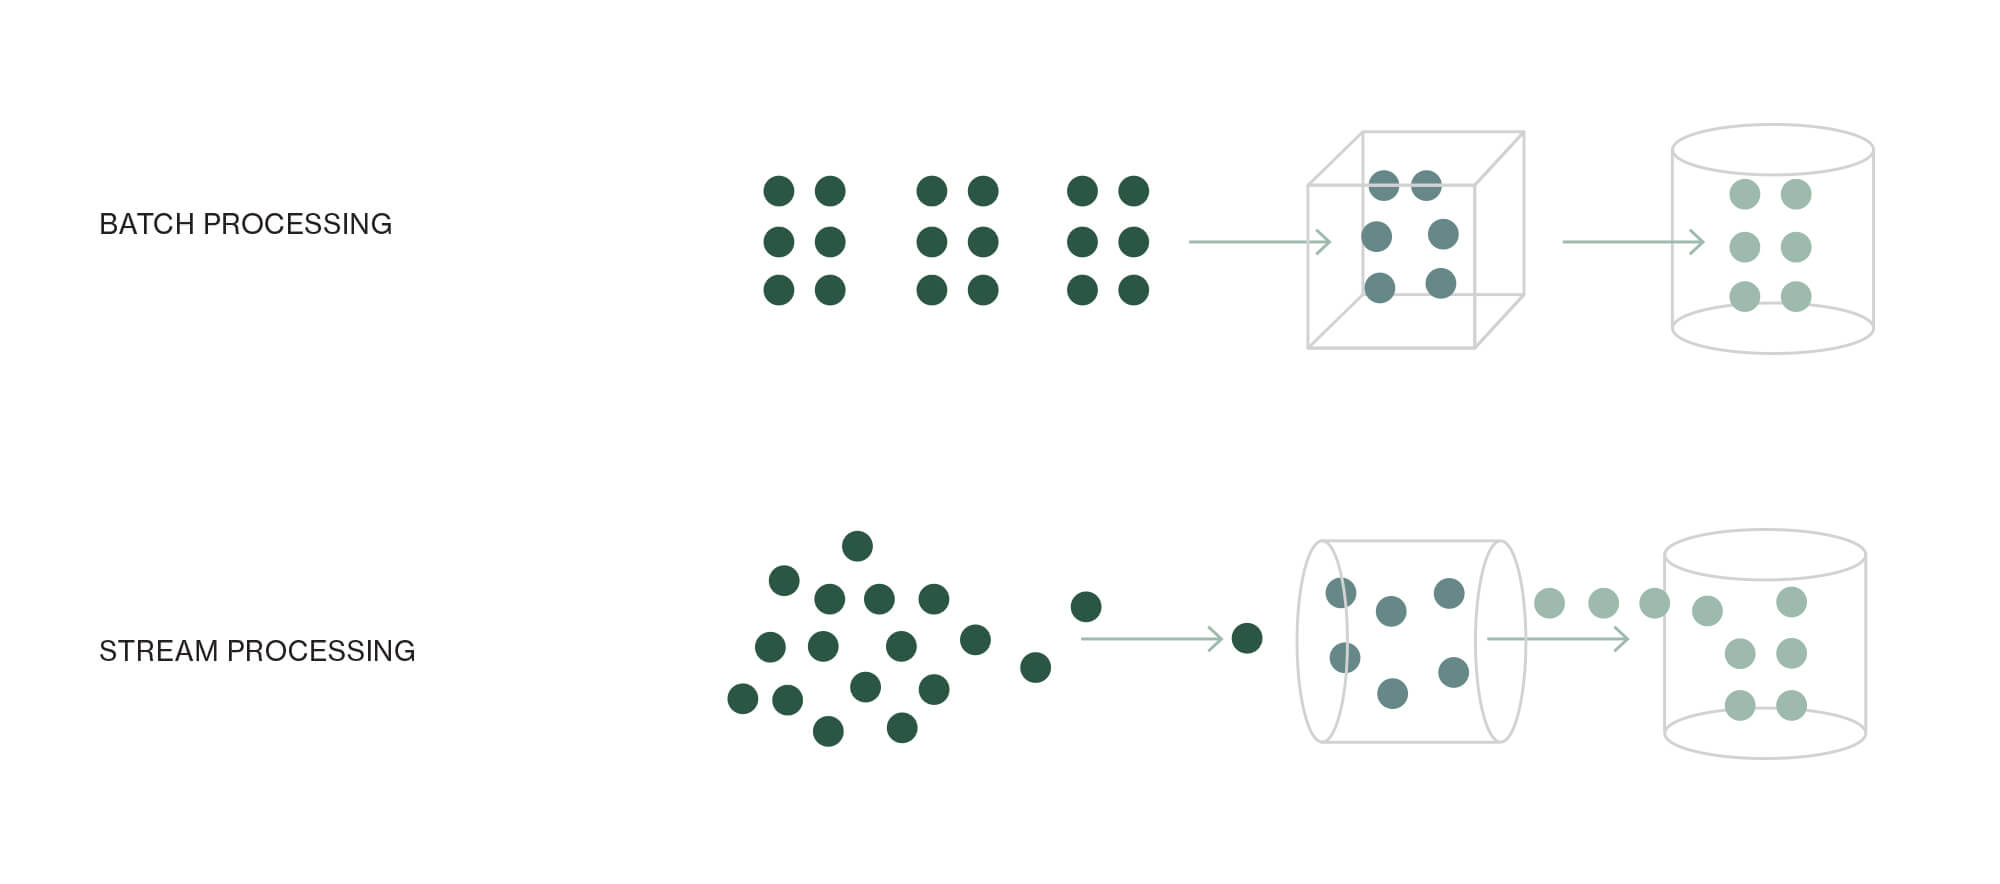
Batch processing is a method where data is handled in large chunks – typically daily or weekly. With this method, we load, clean, and process previously saved data. The processed data is then sent to data scientists/analysts or, further down, to clients so that they can utilize it for their needs.
Stream processing, on the other hand, involves real-time data ingestion. Data is processed as it enters the system, making it ideal for situations where an immediate response is critical.
Because of the short data retention window (one day), streaming systems are more sensitive to errors and require:
- Rapid error handling to prevent data loss
- Efficient processing to keep pace with incoming data
- High scalability to handle traffic spikes
When to use each?
- Use batch processing for in-depth analysis with high data volume. For example, when analyzing user behavior in retail systems.
- Use stream processing when there’s a need to respond to real-time changes, such as anomaly or fraud detection in payment processor systems.
| Batch processing | Stream processing | |
| Description | Processes data in batches (daily/weekly). | Processes data in real-time. |
| Data handling | Processes saved data after loading and cleaning it. | Processes data immediately upon arrival. |
| Sensitivity to errors | Less sensitive because of longer processing intervals. | More sensitive due to its real-time nature and short retention. |
| Retention period | Long (days/weeks). | Short (often 1 day). |
| Reaction to errors | Can be less urgent. | Quick reactions are needed to prevent data loss. |
| Processing speed | Can be more relaxed, not real-time dependent. | Must be rapid and efficient for real-time effectiveness. |
| Scalability | Lower demands for scalability. | Must be highly scalable to handle sudden data spikes. |
| Use cases | In-depth analysis with large context and data volume. | Real-time responses like anomaly detection or fraud. |
| Example | Analyzing user behavior in retail systems. | Fraud detection in payment processing systems. |
| Selection factors to consider | Nature of the analysis, data volume, and client needs. | Real-time nature of data, responsiveness requirements. |
Understanding the client’s goals and data characteristics is key to choosing the right approach. For example, if the data is relatively static, a streaming solution might not be the optimal choice.
Orchestrating data workflows
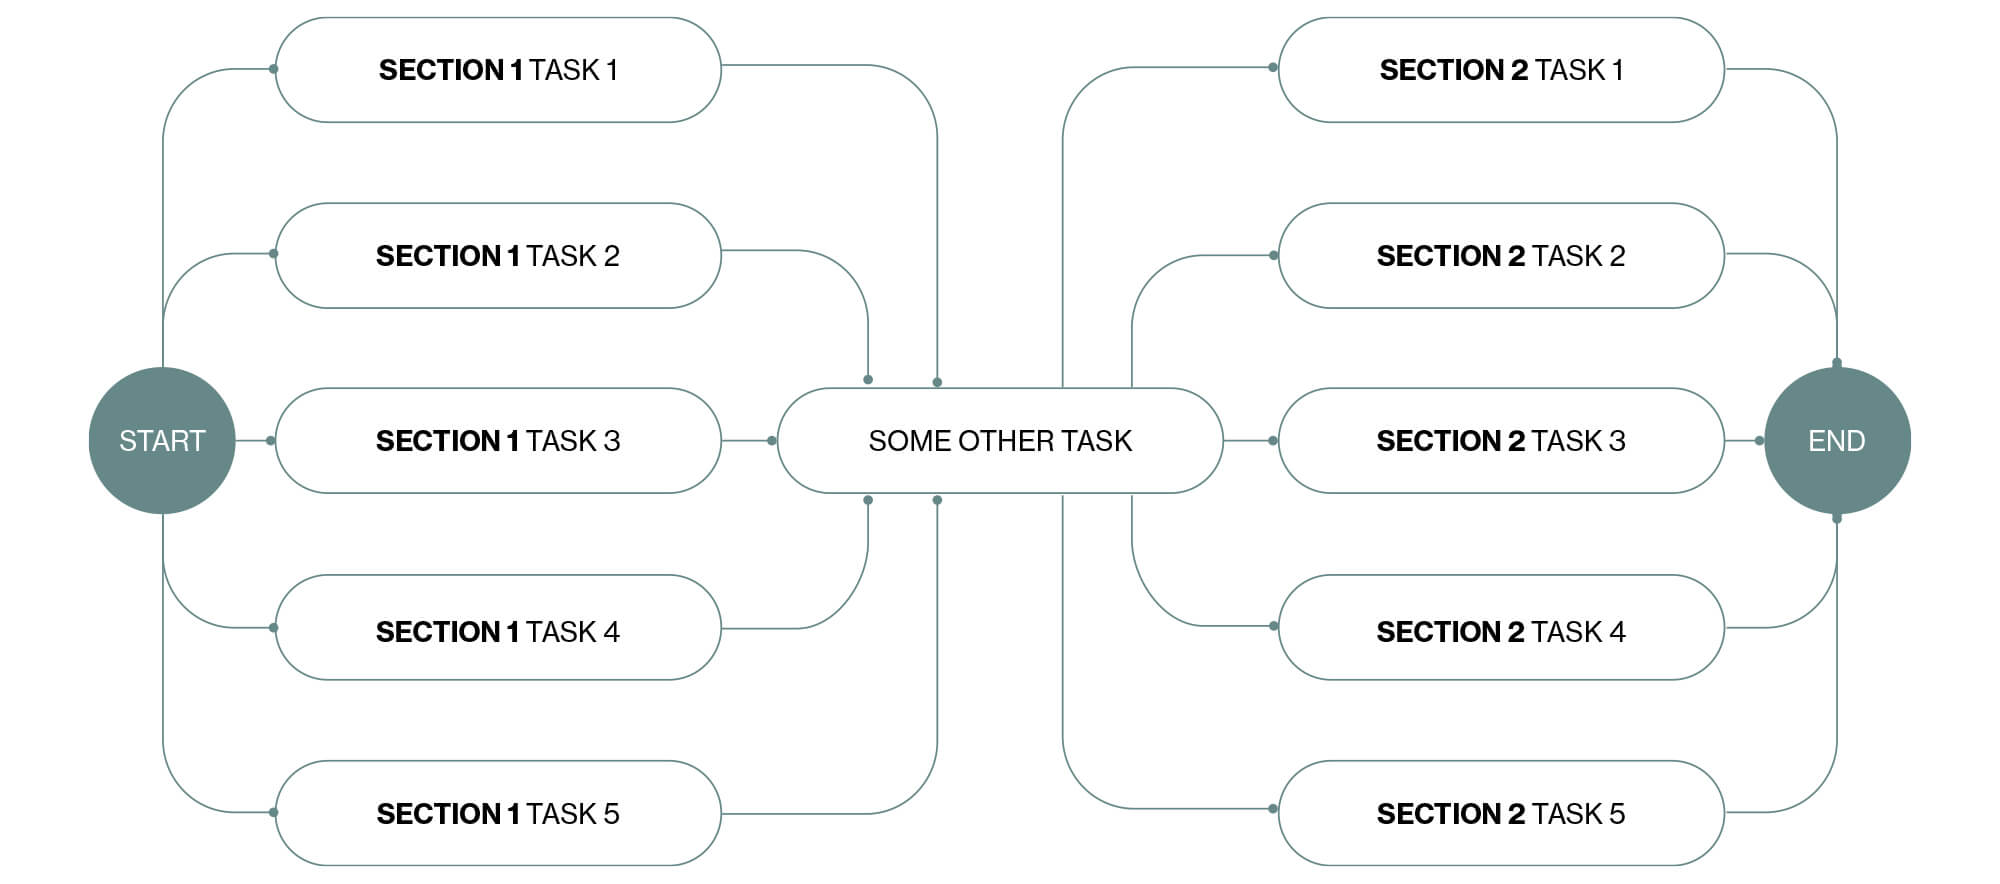
What if there are numerous data sources? How can we synchronize and merge them to ensure they are accurate and ready for further analysis? Typically, one task needs to be successfully completed before another is started. For instance, before combining analytical data with telemetry data, we must confirm that ingestion jobs for both datasets have been successfully executed.
Orchestrators like AIRFLOW assist us in addressing such challenges. AIRFLOW tackles this issue by utilizing DAG (Directed Acyclic Graph). A DAG is essentially a set of tasks slated for execution, arranged to mirror the interconnections and interdependencies among various tasks. By employing this approach, we can structure the tasks in such a way that the specified join operation triggers only when it receives confirmation from both ingestion tasks that they have effectively added the data. If this confirmation is lacking, the join task will not initiate.
Increasing data volume by horizontal or vertical scaling
To efficiently process and adapt to increasing amounts of data, there are a couple of approaches that can be taken:
Vertical scaling
This involves increasing the memory and/or disk size of the processing machine.
Horizontal scaling
This approach utilizes multiple processes running in parallel. These processes can either operate independently or collaboratively within a cluster of machines, functioning as a single unit.
Horizontal scaling, despite having a more intricate setup, offers several benefits, including:
Autoscaling without interruptions
Unlike vertical scaling, which requires the machine to be halted, horizontal scaling enables the addition of new processes without disrupting the entire system.
Almost unlimited dataset size
This is achievable because the data gets distributed among numerous processes and their respective memory spaces.
Horizontal scaling is facilitated through the Map Reduce algorithm, which involves dividing large datasets into smaller batches. Each batch is processed by individual task executors, which then perform summarization operations to reduce the dataset’s size. This method enables efficient handling of substantial data volumes, enhancing scalability and performance.
Real-world applications
NutriU: Centralizing smart cooking data
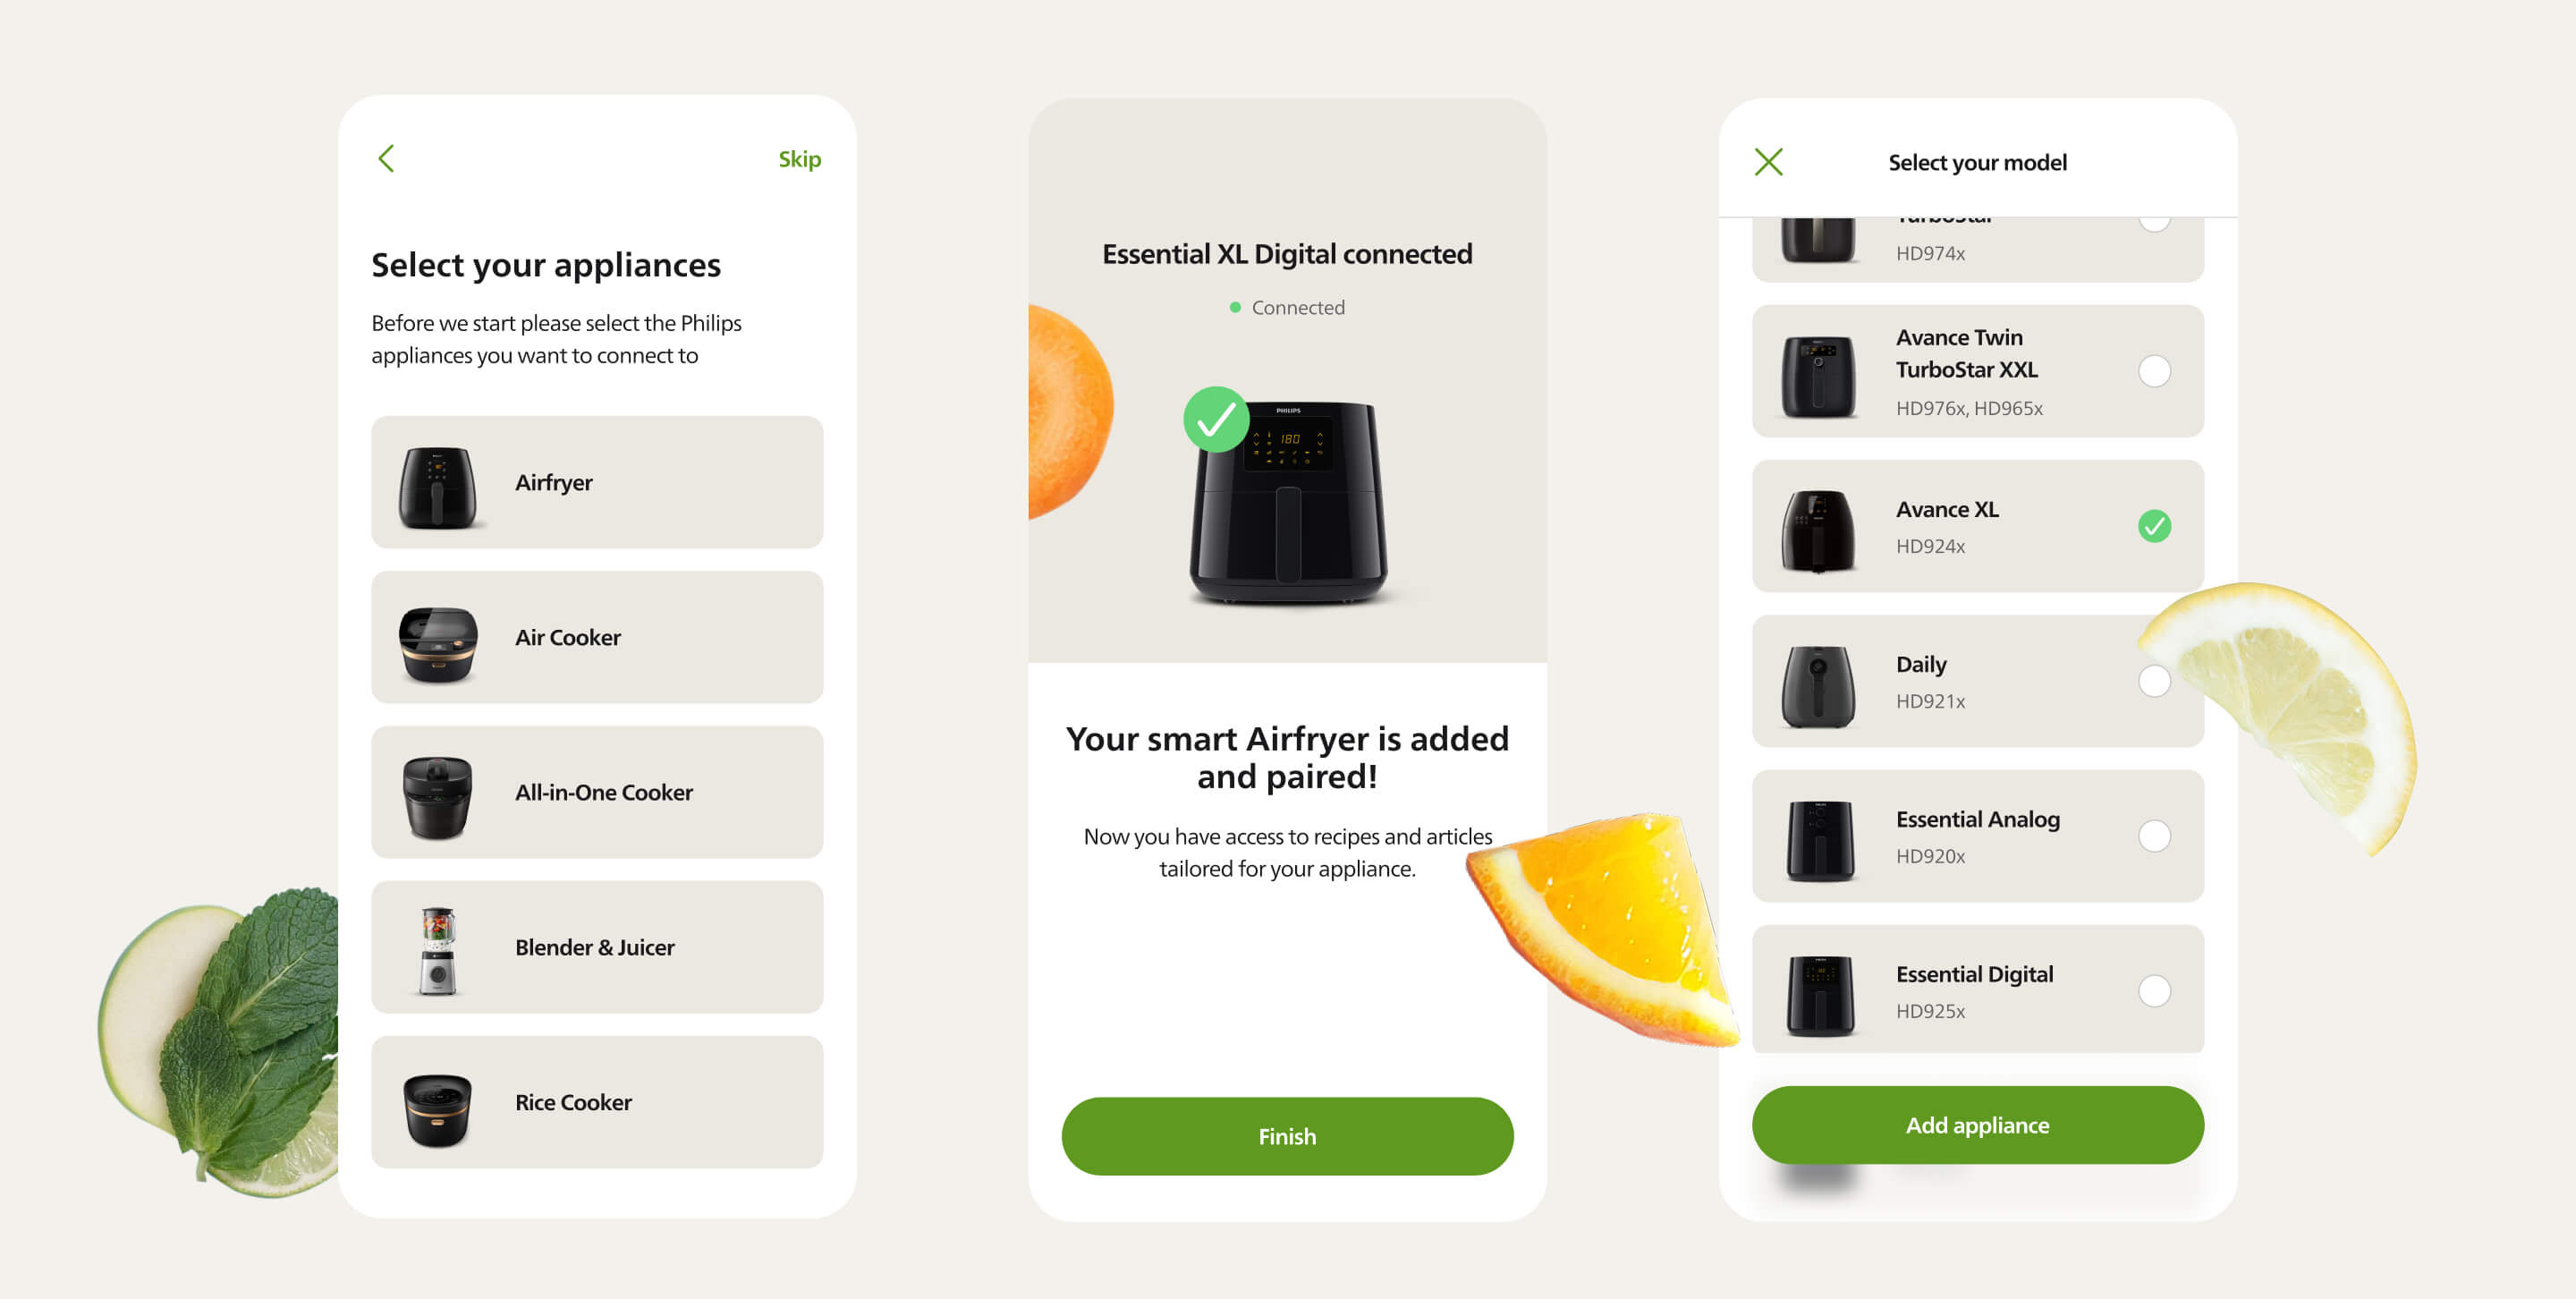
We worked with the client to centralize IoT data from smart cooking devices and backend systems, creating a unified analytics platform with real-time insights and personalized user recommendations.
The client reached out to us to address multiple aspects of their culinary app, covering mobile app development, backend implementation, analytics setup, and integration of smart cooking devices. This involved incorporating IoT data ingestion into the cloud, achieved through the utilization of AWS IoT and AWS Kinesis.
The requirement was to centralize all data for easier analysis and to create a cohesive dashboarding experience that combines various data sources. To achieve this, we employed Firebase Analytics for analytics and its plug-in integration with the BigQuery service.
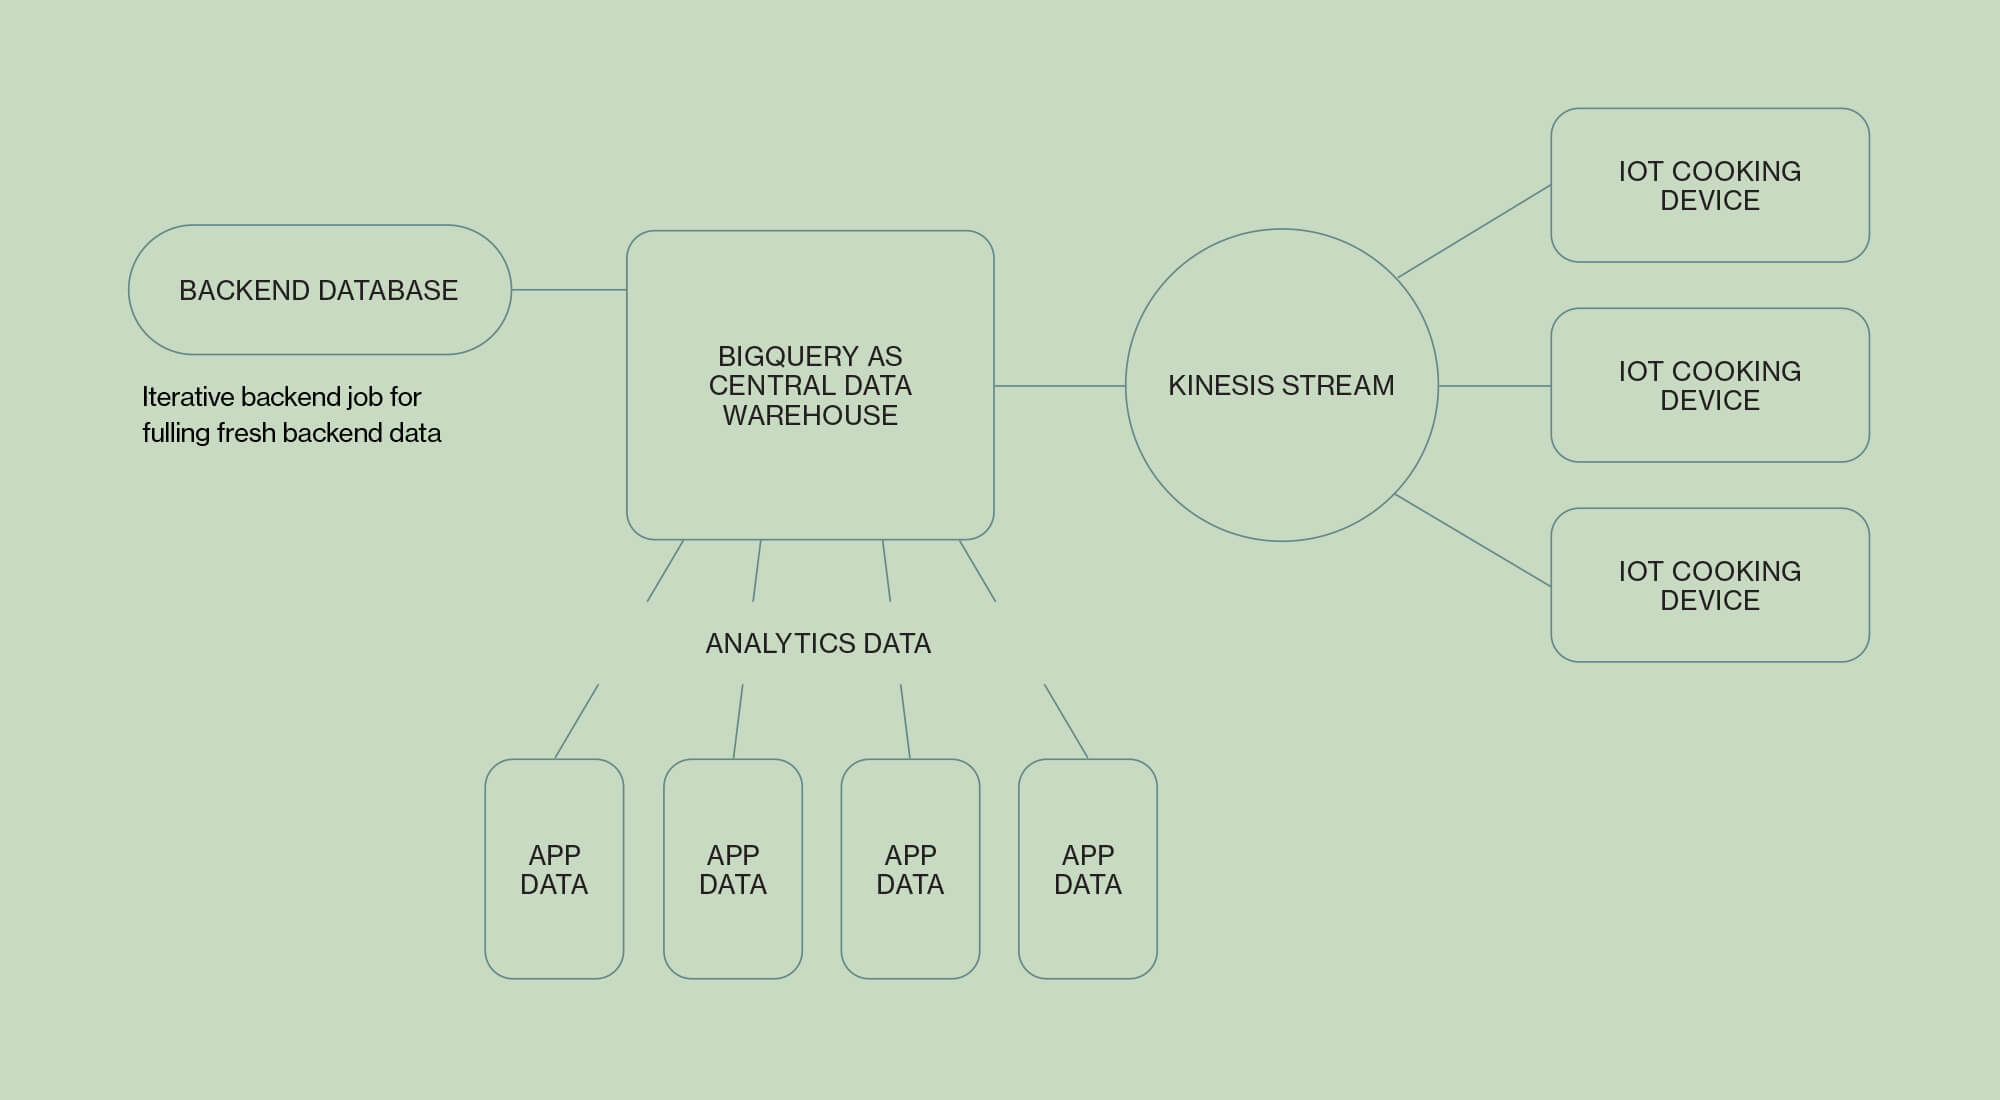
Consequently, we chose BigQuery as the destination point for all data sources:
- For backend data, we established daily batch jobs that retrieve recent data from the Backend API.
- We retained previous updates to facilitate seamless synchronization with the Backend API, pulling only fresh information.
- As for smart devices, we developed a streaming solution utilizing Kinesis consumers to process real-time data.
- Analytics data is already present in BigQuery, so no additional solution was necessary there.
In terms of dashboards, we are orchestrating these jobs to display up-to-date information on various metrics such as the number of active users, total cooking instances, and cooking frequency per user.
The decision to opt for a batch job approach for backend data and stream processing for IoT data is based on the following:
- Backend data solely contributes to reports and dashboards, obviating the need for real-time availability.
- With IoT data, a different objective emerged: utilizing cooking data from devices to assist users in real-time by recommending cooking parameters and subsequent recipes.
Additionally, it’s worth noting that aside from using IoT data for real-time decisions, we also store it in BigQuery. This storage enables the analytics team to enhance their experience. This duality is achieved by having two distinct, independent Kinesis consumers.
Signify: Anomaly detection for facility monitoring
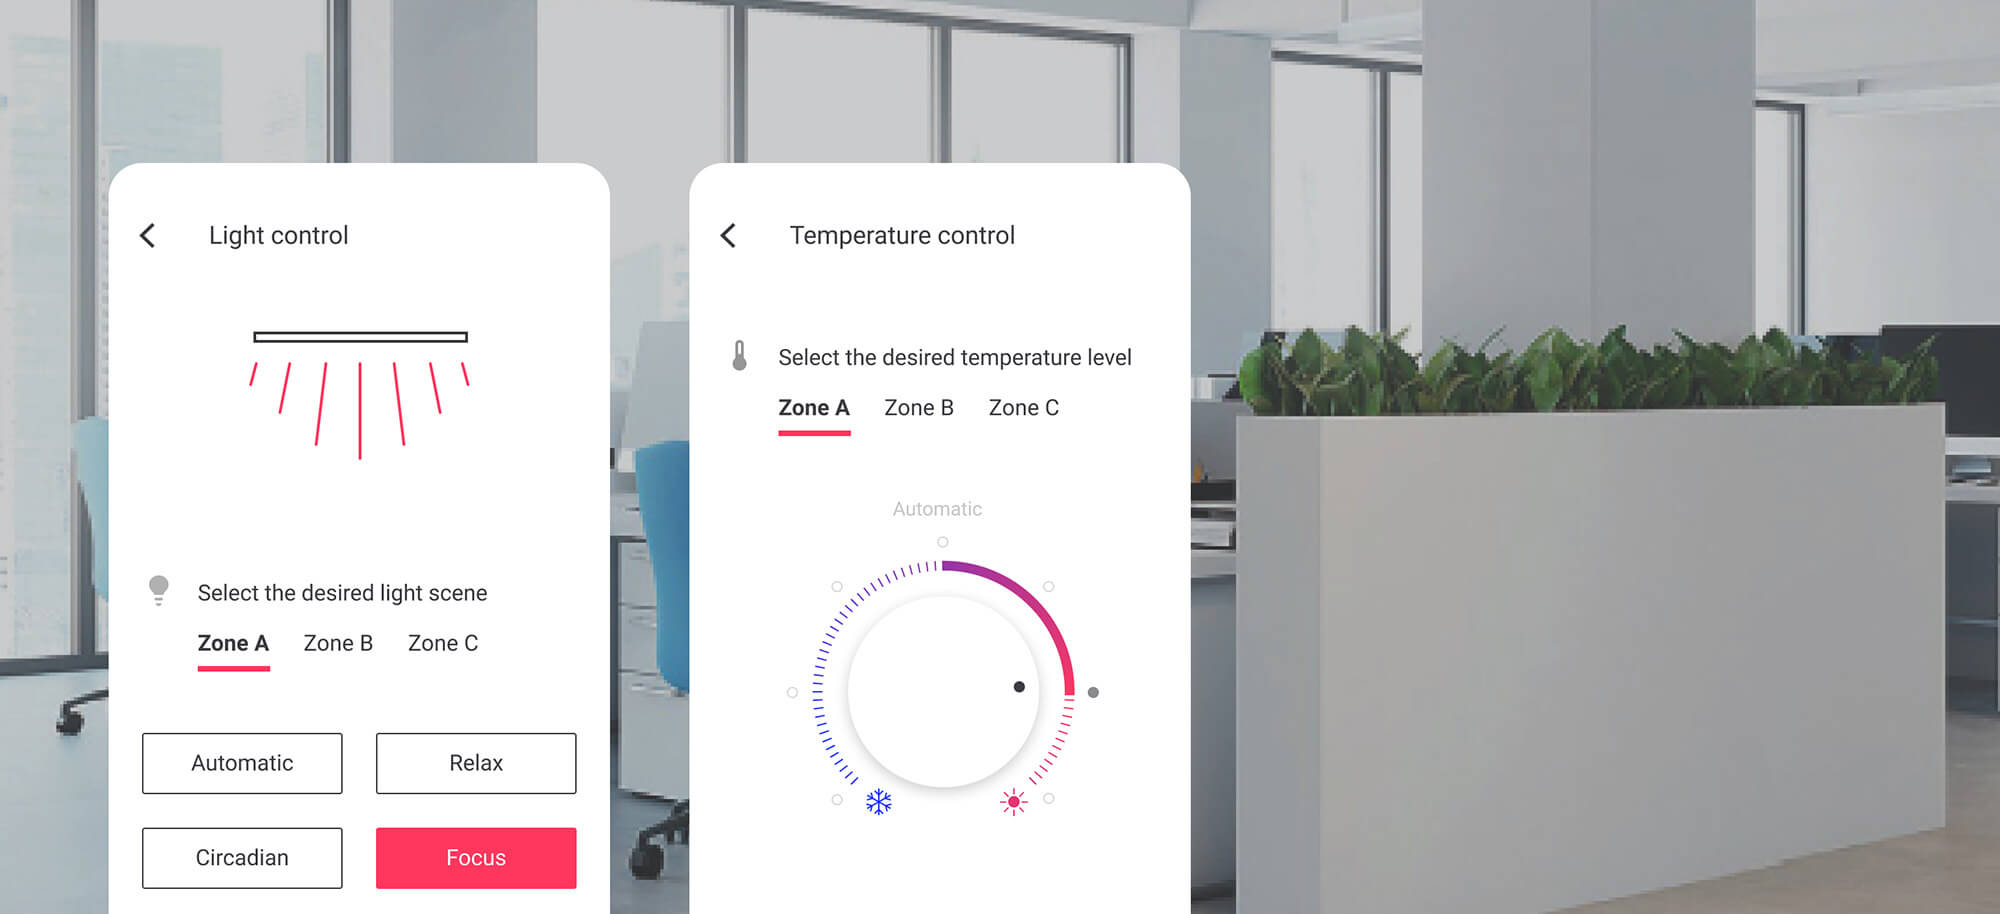
We streamlined facility management for Signify by integrating diverse environmental sensors and data sources into a cohesive system, helping them better monitor and optimize building conditions.
Signify is a company specialized in facility and building management, which includes managing various sensors and data sources, including temperature, humidity, air quality, and occupancy.
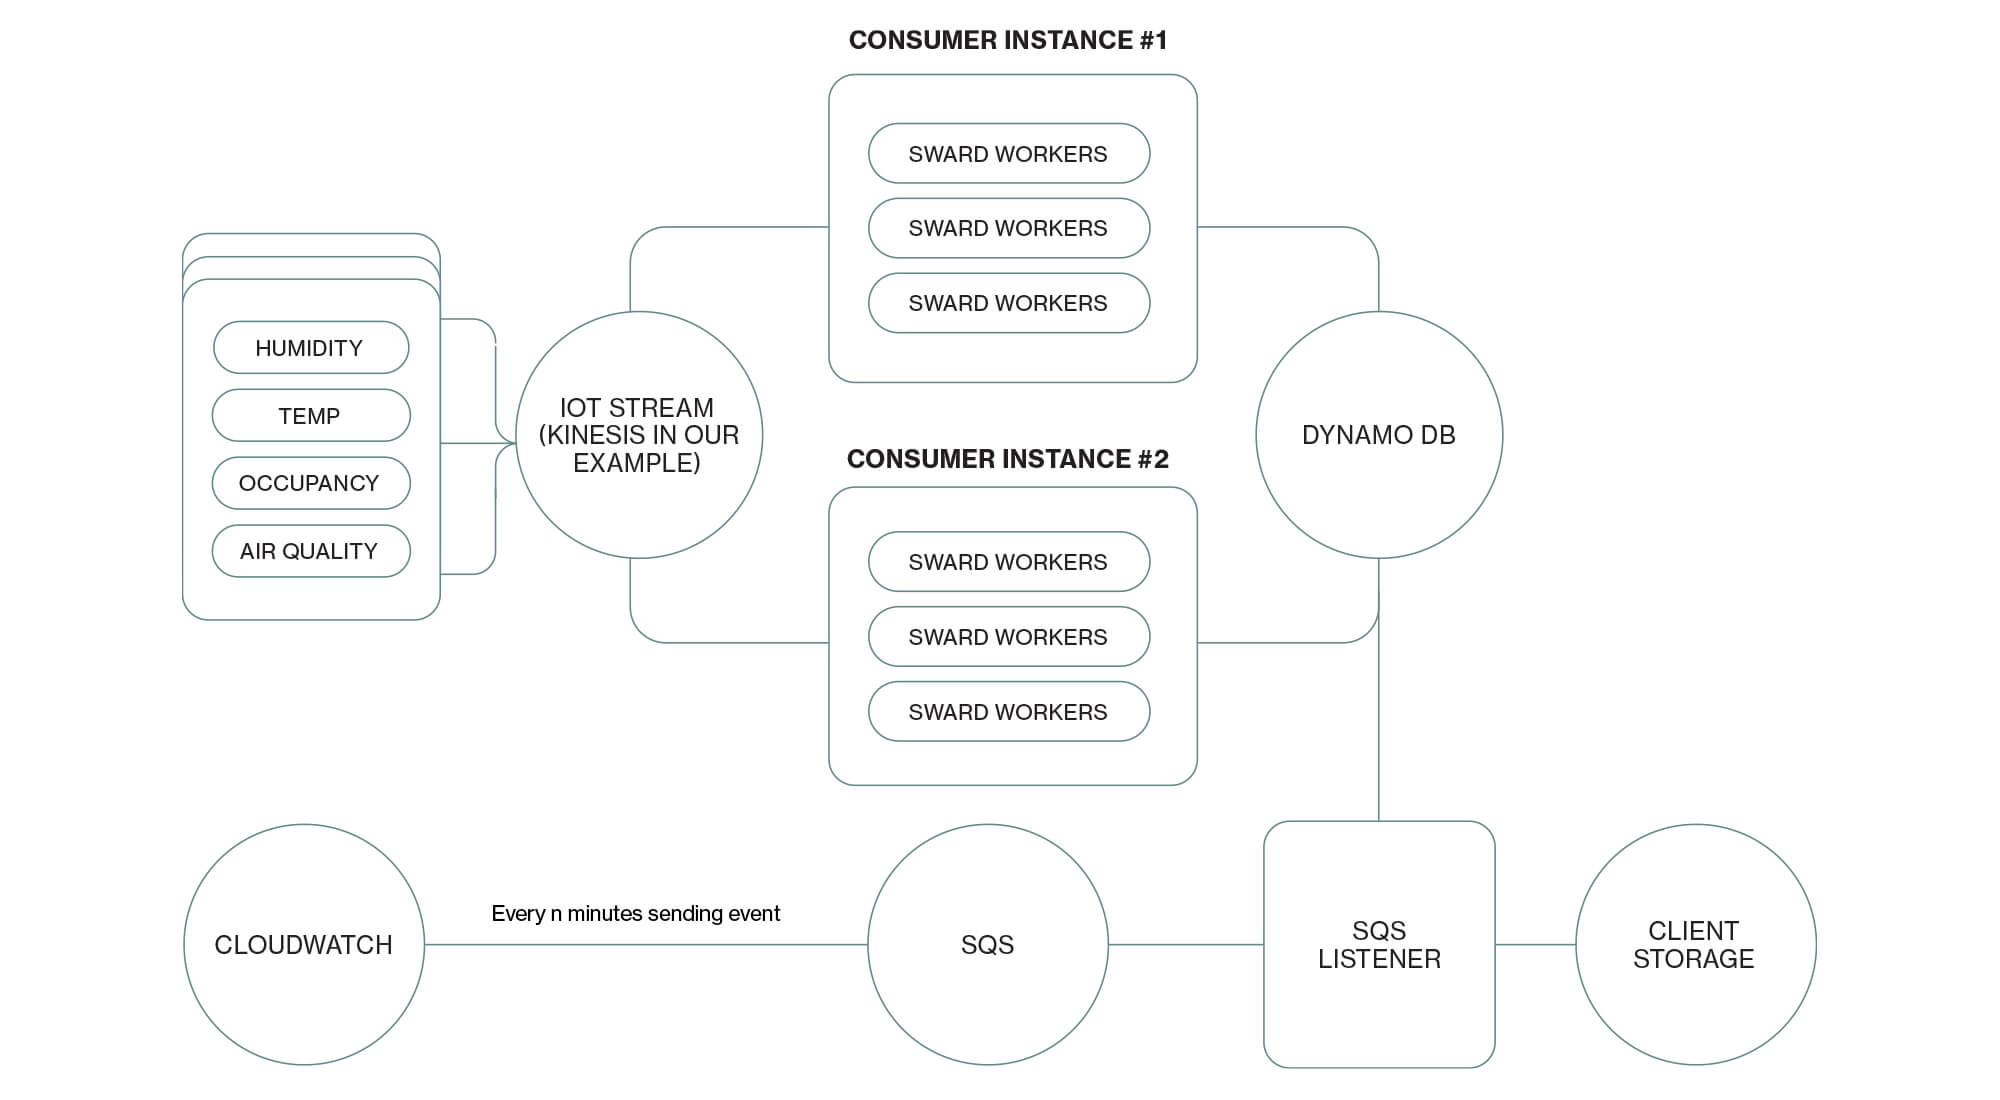
The collected data was directed to the cloud through AWS IoT using AWS Kinesis Data Streams. This data served diverse purposes and was implemented across multiple buildings and floors for different clients, each with distinct requirements. One specific client encountered an issue with a constant influx of information arriving every second. They requested the results to be condensed into defined time intervals, such as every 15 minutes or one hour.
In essence, the purpose of the system that we designed was to detect anomalies in clients’ facilities, such as drops in air quality.
The tasks included:
- Configuring the Kinesis cluster to handle the estimated data volume
- Adjusting the number of shards
- Monitoring CloudWatch data and Kinesis metrics to assess read and write capacity, as well as the presence of unprocessed data in the stream (maximum age in seconds before processing)
- Developing Kinesis consumer services to process real-time data
- Creating efficient code to smoothly execute data integrations, reshape the data, and forward it through the pipeline – to the client via API and to designated storage (e.g., an S3 bucket)
- Designing the code with flexibility to accommodate the varying needs of each client
- Establishing multiple instances of Kinesis consumers to enhance load handling (horizontal scaling)
The client essentially requested a transformation of the streaming system into a batch-oriented version. It was intricate work. Kinesis workers have a polling limitation of 5 minutes; beyond that, they go idle and require a restart. Sending data every 5 minutes did not meet the client’s needs, as their minimum required interval was 15 minutes.
So we developed a solution that would direct data from Kinesis to DynamoDB, utilize CloudWatch to trigger an event in SQS at specified time intervals, and utilize an AWS SQS listener to await the event, and upon its occurrence, retrieve data from DynamoDB, aggregate it, and transmit it to the client. This solution allowed the client to set any time interval required.
Final thoughts
Setting up an IoT data pipeline isn’t just about choosing the right technologies – it’s about aligning data architecture with real business needs. Whether through batch jobs, real-time streams, or hybrid approaches, the goal is the same: to process, manage, and activate data in a way that delivers real value to the user.
This article is adapted from our Guide to Successful IoT Implementation, where we cover the technical foundations and strategic considerations behind building modern IoT solutions. For more insights, download the full guide.


