2021 was eventful, to put it mildly.
We continued our fight against Covid-19. Bitcoin became legal tender in Ecuador. Facebook somehow figured that the only thing they should change was their name. Protests about climate change shook the world. Ingenuity performed the first powered flight on another planet in history.
In addition to the anti-pandemic vaccination, we started vaccinating people for malaria.
The hype about Spotify Wrapped
It seems we coped slightly better with the things going on in the world this year as opposed to the last. For some, it was because they were finally allowed to go back to the office and hang out with friends safely-ish after getting their shot(s). For others, it was the memes. And for some, it was music.
It’s always fun getting your Spotify Wrapped. The slight jabs about your music taste. The slight feeling of shame that you get when you realize that you’ve listened to a thousand minutes of trap turbo-folk. The immense feeling of delight when you find out you’re in the top 2% of listeners of Arctic Monkeys. The envy you feel for the people who were able to get a ticket for their concert in Pula. I digress, but you get the point. It’s a vibe.
It’s also fun to share with your friends and colleagues to show them how superior your music taste is to theirs. As one of our project managers put it, in this little social experiment, everyone is eager to share their results, but not without a disclaimer that would justify the Justin Bieber in their top 5. Anyway, as we were sharing the results amongst ourselves, one thing led to another, and we ended up with a substantial public playlist called Infinum Wrapped.
Infinum Wrapped 2021 is a 237-song, 15.5-hour monstrosity spanning from Russian rave music to Britney Spears and Lepa Brena. Even Baby Shark is on there.
Spotify has an API…
Next thing you know, I had the idea to play around with Spotify’s API to see what kind of data we could get from our playlist.
It’s worth noting that Spotify’s API isn’t really your garden-variety API. Their API allows you to fetch metadata about pretty much all objects on Spotify – playlists included. Not only that, but it provides some very interesting data about particular tracks from the musical standpoint in a feature they call Get Tracks’ Audio Features.
This includes features like acousticness, a confidence measure that the track is acoustic; danceability, which is basically Spotify’s guess of how likely it is that you’re going to embarrass yourself to this track after a few drinks, and valence, which is a measure that describes how happy the song sounds. Note that this doesn’t really correlate with whether or not the song is actually happy, and a great example of that would be the song Mr. Brightside.
We’re also able to get more information about tracks’ musical structure using their Get Tracks’ Audio Analysis feature, but to be honest, I’m not really into music theory.
However, Spotify’s API features gave me the idea to take a little peek at what kind of music Infinum listens to and answer questions nobody knew they wanted an answer to.
Getting the data
As for getting the data, that’s fairly straightforward. Spotify has a pretty ordinary REST API interface, authenticated using OAuth2. We’ve written many times about APIs, both on the Infinum blog and in our Handbooks, so I will be glossing over this a bit in the interest of time and not boring you.
To be able to connect to Spotify’s account, you’ll need a Spotify Developer account. Fortunately, it’s a free, one-click process at developer.spotify.com (looking at you, Apple). By going to Dashboard and logging in with your Spotify account, you’ll be able to create an app, fill in your redirect URL and get your OAuth2 ID and secret. After that, you just authorize against https://accounts.spotify.com/authorize and get your token. Spotify has a great guide for this if you want to follow along.
To make this as easy as possible, I’m using Postman to authenticate requests to Spotify, and you can use it, curl, or a similar tool to do so as well. After getting authorization using Postman, I’ll be using PHP to send requests to Spotify and analyze the responses.
After authentication, we can simply make an (authorized) request to get data about our playlist:
GET https://api.spotify.com/v1/playlists/1HYLxifwkdyUxxjDgGv31h
Spotify responds with a mere 45 630-line response, detailing metadata of the playlist and all the songs in it.
Assuming we’re using PHP, Composer and Guzzle, given a token, getting our playlist becomes nine lines of code:
<?php

include ’vendor/autoload.php’;

$token = file_get_contents(’.token’);
$spotifyClient = new \GuzzleHttp\Client([
   ’base_uri’ => ’https://api.spotify.com/v1/’,
   ’headers’ => [
       ’Authorization’ => ’Bearer ’ . $token
   ]
]);

$playlist = json_decode($spotifyClient->get(’playlists/1HYLxifwkdyUxxjDgGv31h’)->getBody()->getContents());
Or so you’d be fooled. This is a particularly large playlist, so Spotify paginates the responses, meaning we’ll have to do this in a few more requests.
Luckily, this is simple to do, as we can just follow a link they’re including in the response. We can simply fetch all of the items and save them to a file:
$next = $playlist->tracks->next;
$tracks = $playlist->tracks->items;
$i = 1;
while($next) {
   $playlist = json_decode($spotifyClient->get($next)->getBody()->getContents());
   $tracks = array_merge($tracks, $playlist->items);
   file_put_contents("playlist.resp{$i}.json", json_encode($playlist));
   $next = $playlist->next;
   $i++;
}
The code above also constructs an array containing all tracks in the playlist and their metadata, which allows us to iterate over the tracks. Each member of the $tracks array is a stdClass object. This will come in handy for a lot of things, such as fetching each track’s musical features.
For instance, we can simply create an array with keys being user IDs and values being an array of track objects that they’ve added to the playlist like so:
$songsOfPeople = [];
foreach ($tracks as $track) {
   $songsOfPeople[$track->added_by->id] = array_merge($songsOfPeople[$track->added_by->id] ?? [], [$track]);
}
(Arrays in PHP are an amazing thing, really. They’ll be carrying a lot throughout this article.)
We can also iterate over each track’s artists to count how many times a certain artists appears in the playlist:
foreach ($tracks as $track) {
   foreach ($track->track->artists as $artist) {
       $artists[$artist->name] = ($artists[$artist->name] ?? 0) + 1;
   }
}
Now that’s done, we can already start doing some analysis. But first, let’s fetch a bit more data about each song – the audio features we discussed previously.
Fetching that data, caching it to a file and mapping it to a song in an array now becomes just a few lines of code:
$trackAudioFeatures = [];
foreach($tracks as $track) {
   $trackId = $track->track->id;

   $audioFeatures = json_decode($spotifyClient->get("audio-features/{$trackId}")->getBody()->getContents());
   $trackAudioFeatures[$trackId] = $audioFeatures;
   file_put_contents("audio-features/{$TrackId}.json", json_encode($audioFeatures));
   usleep(300000); // Let’s avoid getting rate limited
}
What does Infinum sound like?
I know you came here for the juicy findings, not for the PHP code leading to them, so let’s dig into that.
Keep in mind that a total of 48 people added songs to this playlist. This amounts to about 13% of Infinum, which isn’t really representative of us as a whole. Still, it’s fun and gives you a little insight into how different we all are.
The most popular artists
The easiest question to answer, it would seem. But as most things in life and software, that ease is a deception.
To get any kind of meaning from our data, we’ll have to analyse people’s relationships with music, not just the music itself.
For instance, just counting the number of times an artist shows up on the playlist would give us the impression that the British progressive metal band Monuments is the most popular artist at Infinum, with it being added to the playlist five times. This type of analysis is completely oblivious to the fact that a single person seemingly only listens to Monuments and has added five of their songs to the playlist. Nobody else taking part in our experiment added any of their songs.
Fortunately, we can build an array mapping artists to the (unique) users who’ve added them to the playlist.
foreach($tracks as $track) {
       $artists[$artist->name] = array_unique(array_merge($artists[$artist->name] ?? [], [$track->added_by->id]), SORT_REGULAR);
}
We can even nicely sort them by the number of times they appear to make our job of finding the most popular ones easier:
uasort($artists, function ($a, $b) {
   return count($a) <=> count($b);
});
This gives us a five-way tie for our first annual “Most popular artist according to a selection of Infinum’s employees” award. Before we reveal who the winners are, here are a few quick facts:
- We added 268 distinct artists to the playlist
- We have a 10-way tie for the second place of this prestigious award
The second-place artists have two listeners, while the winners have three. This was bound to happen on such a small sample, but it also gives you a little insight into our collective differences.
This year, most Infinum employees listened to Ed Sheeran, Senidah, The Weeknd, Lil Nas X and Hurricane.
The runner-up artists included Elder Island, Travis Scott, Dua Lipa, Relja, Krankšvester, Justin Bieber, Svemirko, Bryan Adams, Steve Lacy, and Pocket Palma.
The most popular genre
But of course, just looking at the artist counts wouldn’t be enough, would it? If we look at the genre counts (after fetching them in a similar fashion to what we’ve done above), we can get a bit closer to knowing Infinum’s taste in music. And it’s not a tie this time – not even close.
The most popular genre is pop, with 40 out of the 268 distinct artists being classified as pop. It’s followed by dance pop, in an anticlimactic result, with 26 matched artists. However, dance pop is closely (off-by-one) followed by rock, after which comes turbo folk with 19 artists matching it.
We also like tropical house, EDM and rap, all of which have 15 matched artists. Guess you could say we like dancing with our long legs.
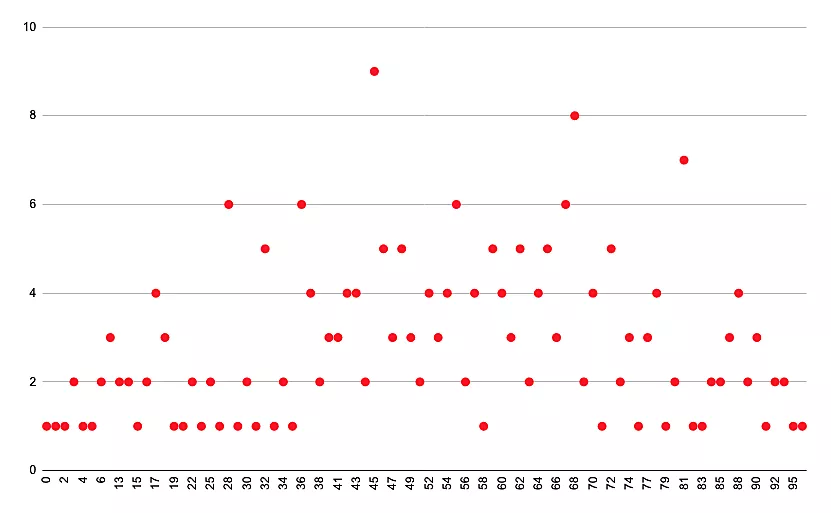
As for whether or not we’re hipsters, it’s hard to say. Looking at the popularity of the songs on the playlist, they’re everywhere. Spotify measures the popularity as the popularity of the artist: “The value will be between 0 and 100, with 100 being the most popular. The artist’s popularity is calculated from the popularity of all the artist’s tracks.”
In our case, popularity has a minimum of 0 – someone’s really into obscure artists like Sarkozy’s wife Carla Bruni, and a maximum of 97 (maybe someone has a side gig of being a radio DJ), with the average being around 53 – authentically average.

Putting Spotify’s metrics into graphs
As mentioned earlier, Spotify provides access into their musical insights. This means that we can check how happy Spotify thinks a given song is, according to its tempo, energy, and more.
If we were mathematically inclined, we could perhaps find the graph of how these metrics are distributed… So we did just that.
Danceability
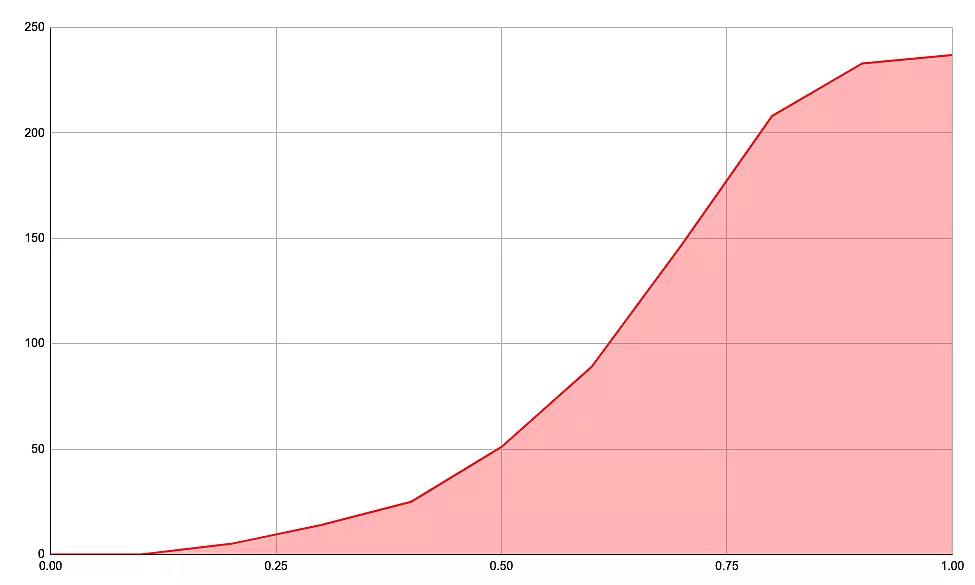
The X-axis shows the danceability metric, while the y-axis shows the number of songs “less or equally danceable to” than the X-axis.

It seems that we really like dancing – an average song on our playlist has a danceability score of 0.63, which means Spotify thinks that there’s a 63% chance that you’ll break some crystal glasses to them.
The least danceable song on our playlist with a pitiful danceability score of just 0.12 is Maenam by Jami Sieber, an acoustic cello recording. The most danceable song on here, however, has an amazing danceability score of 0.929 and it’s Marinade by DOPE LEMON, which did surprise me a bit. Also, what an amazing name DOPE LEMON is.
As for tempo, we usually keep ourselves around 120 BPM, but songs go everywhere from 48 BPM up to 121. Loudness is also a bit all over the place, averaging -7.3 dB, but going from -17.29 dB up to -1.7 dB.
Energy
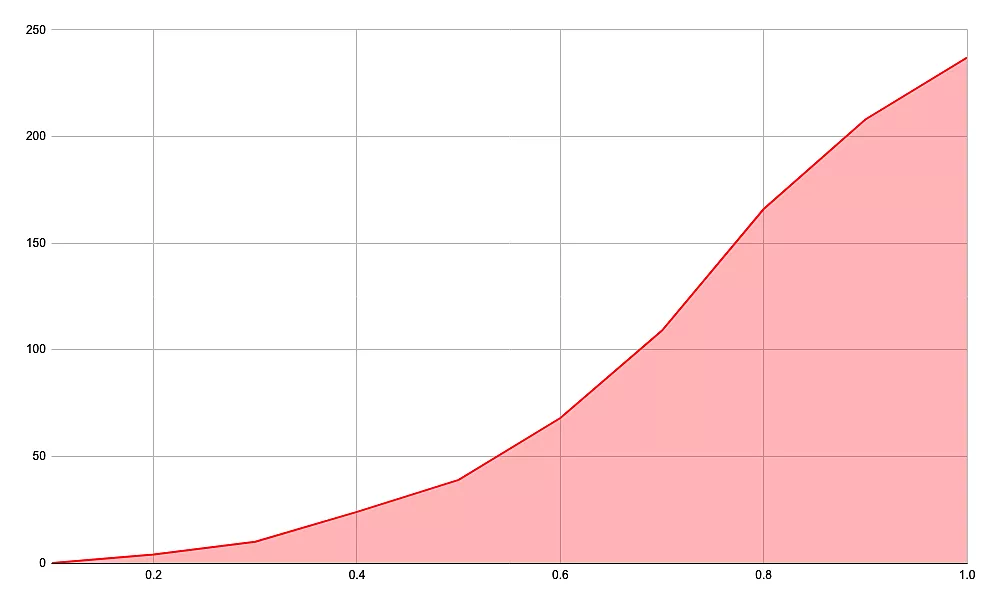
Spotify also has the energy metric, which is a mathematical way to describe the difference between Bach and death metal, according to their documentation:
Energy is a measure from 0.0 to 1.0 and represents a perceptual measure of intensity and activity. Typically, energetic tracks feel fast, loud, and noisy. For example, death metal has high energy, while a Bach prelude scores low on the scale. Perceptual features contributing to this attribute include dynamic range, perceived loudness, timbre, onset rate, and general entropy.
The least energetic song on this playlist scores a mere 0.127 on the scale, and unsurprisingly, it’s Tiho, Tiho (meaning Quiet, quiet) by the Croatian new-wave band Idoli. The polar opposite of this song on our playlist is Benbare & Saundsistemi (meaning BMWs & Soundsystems) by the Croatian band Krankšvester, scoring the amazing 0.994 score on Spotify’s scale.
It’s hard to top that score! On average, though, songs on our playlist score a respectable energy metric of 0.684. Maybe we drink too much coffee.
Valence, a.k.a. happiness

We’re down to the last question I’d like to answer here – and it’s the ultimate one. How happy are we? Unfortunately, HR told me I’m deeply unqualified to answer that question, and the latest evidence suggests we’re a very happy bunch indeed, so l can only take a look at how happy the songs we listen to are.
Fortunately, this is made easy by Spotify’s valence metric which they describe as “a measure from 0.0 to 1.0 describing the musical positiveness conveyed by a track. Tracks with high valence sound more positive (e.g. happy, cheerful, euphoric), while tracks with low valence sound more negative (e.g. sad, depressed, angry).”
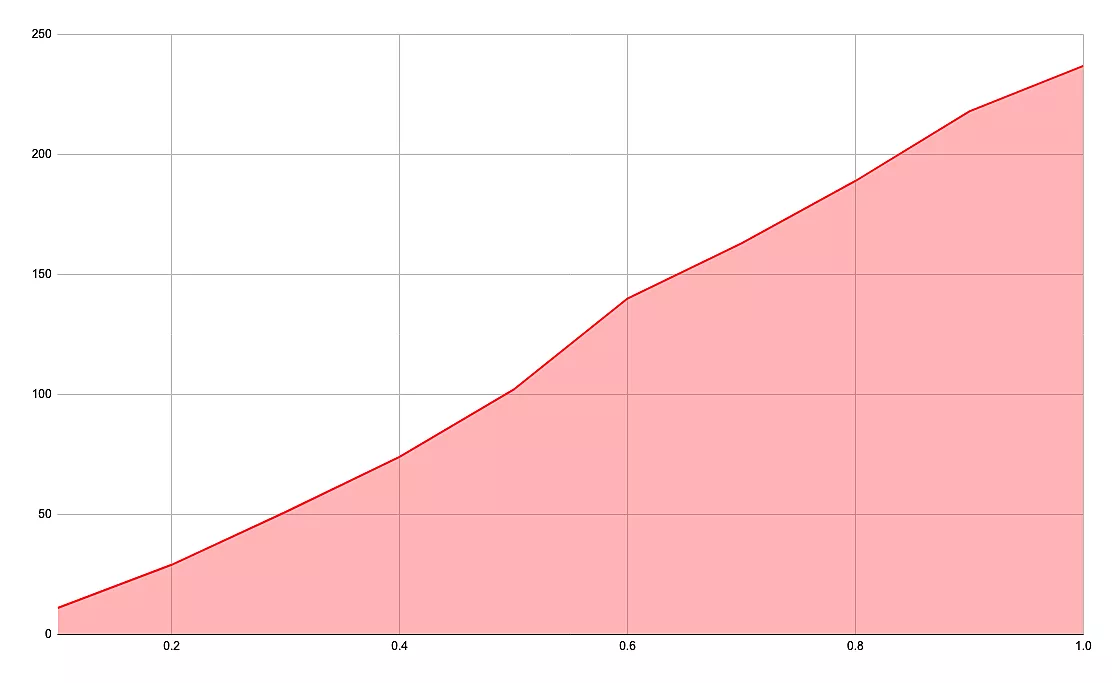
And it’s an interesting thing to look at. Without revealing the songs in question just yet, let’s take a look at the distribution graph.

From the graph, we can see that this is almost a line. A bit wobbly, though. This means that the pace of growth for our valence metric is steady throughout the dataset – the happiness of songs is almost perfectly equally distributed throughout the playlist. It is a bit steeper on the happy end, though, so it seems like we do listen to happy music than tearjerkers.
This makes our average valence score of 0.539 absolutely unsurprising.
The minimum valence score of 0.0338 is achieved by the song Lead Squid by The Kilimanjaro Darkjazz Ensamble. I took a quick listen, and it really does sound dark. Maybe it’s just me, but I’m getting weird evil magical forest vibes from it.
There are 10 more songs that score less than 0.1. Gotta check if my teammates are okay. But we’re not here for the dark, evil vibes. We want to find out who’s maximum happy.
Without further ado, with the valence score of 0.985, the happiest-sounding song in our playlist is a live rendition of Alicia Keys’ ocean eyes. At least according to Spotify. Got a feeling some of us might disagree.
It’s closely followed by Sukadar Bukadar by Valentino Bošković and Sun Comes Up by Rudimental and James Arthur, both of which score 0.966 on the valence metric and sound more like it. They also get close competition from Grubišno polje by JeboTon Ansambl and Stuck In The Middle by Stealers Wheel, which score 0.965 and 0.964 respectively.
Wrapping up Infinum Wrapped
If you ever find yourself at a gig, chances are you’ll meet someone from Infinum.
By now you’ve figured there’s no need to specify which kind of a gig – you could meet us at Senidah and Milica Todorović, Carla Bruni, ДЕТИ RAVE, Tame Impala, or Lil Nas X. We’re really a diverse bunch in that regard.
However, if you’re at a party and you see a bunch of men taking off their shirts to this song, it’s 100% somebody from Infinum. It’s basically our company’s anthem, and we even made a film inspired by it.
Speaking of film, that’s a wrap. Now you know what we sound like. If you’d like to know even more about us, check out our careers page and maybe next year you’ll be rocking (or taking your shirt off) to Program tvog kompjutera with us.
Until then, enjoy Infinum Wrapped and let’s hope the sound of 2022 will be music to everyone’s ears.


