


Mobile app consumers, product owners, and developers all have one thing in common – everybody wants a beautiful, functional, and crash-free app.
However, when talking about mobile app development, developers tend to spend so much time just testing the app and checking if everything works correctly in certain conditions.
Depending on the tools we decide to use, we can either waste time reading monosans letters in the logger or have everything implemented in an interactive way so that the information we need is reachable at our fingertips.
We’ve developed two libraries to help you take advantage of debugging and make your life easier.
Collar – a library for analytics debugging
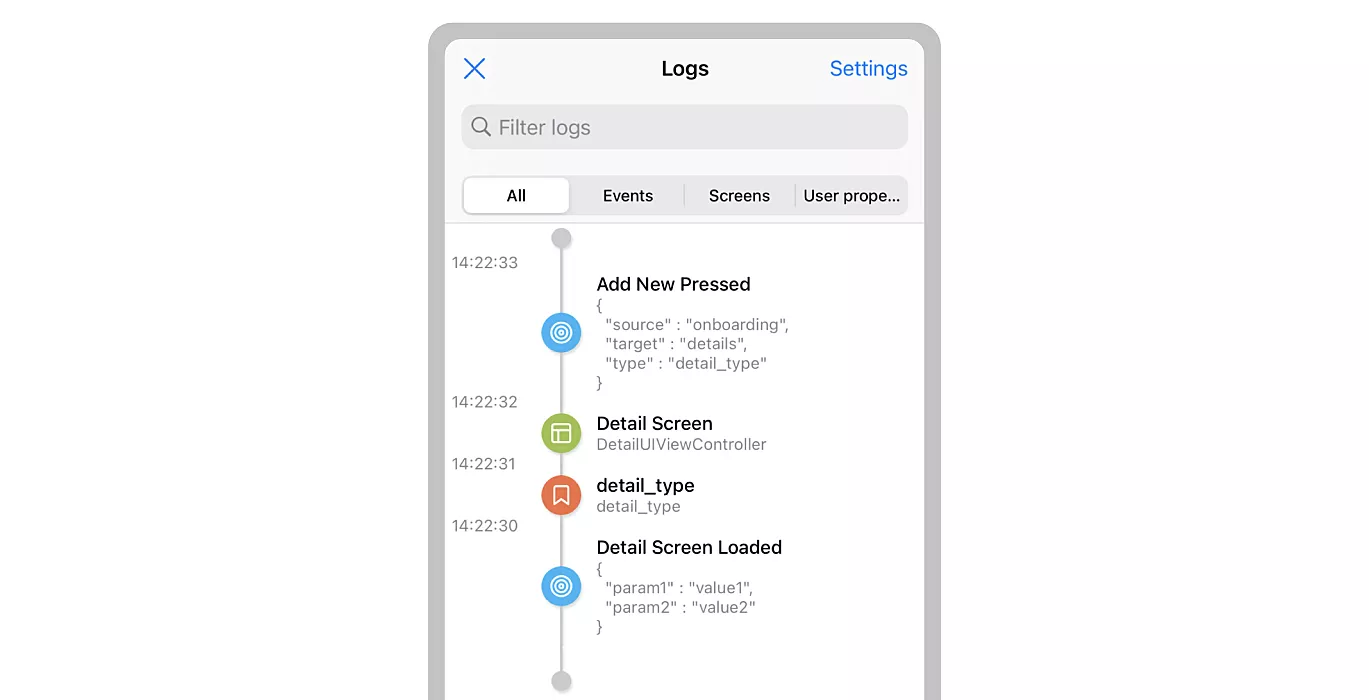
Collar is a library for analytics debugging that can show you three types of analytic collecting data as they happen in the app: events, screens, and user properties.
It is easy to configure and straightforward to use – it’s as simple as just importing the library and using several methods to collect the data for preview.
import Collar
After you’ve imported the library, you can add three analytic collecting types. To collect events, see the code below.
// Events
AnalyticsCollectionManager
.shared
.log(
event: "some_event",
parameters: [
                "param1": "value1",
                "param2": "value2"
]
)

// User properties
AnalyticsCollectionManager
.shared
.setUserProperty("some_value", forName: "user_property_key")

// Screen views
AnalyticsCollectionManager
.shared
.track(screenName: "Home", screenClass: "HomeViewController")
As you can see, collecting the data is simple and does not require much work. However, please remember that Collar does not send out any analytics data to remote services. Developers are left with solving this within their own codebases, and Collar is just there to reflect the current state of the analytics data.
To display events, you can choose to view it as a popup every time when the Collar collects any analytics or at some specific point which will display all of the collected data.
You should insert the line below to view the analytics as a list at a specific point in the code lifecycle.
AnalyticsCollectionManager.shared.showLogs(from: viewController)
To see it as a popup every time something gets collected, insert the code below.
// Also controllable from settings screen inside logs view
LogItemPopupQueue.shared.enabled = true
// Popup dismisses on tap or after defined number of seconds
LogItemPopupQueue.shared.showOnView = { UIApplication.shared.keyWindow }
You can also choose to receive notifications when new logs are added to the list, so your app can observe the AnalyticsCollectionManager.Notification.didUpdateLogs notification.
Important information
Bear in mind that AnalyticsCollectionManager and LogItemPopupQueue are not meant to be used in production builds. The best option is to exclude Collar from your production targets/configurations altogether. This can be done by following the Podfile configuration example below.
pod ‘Collar’, :configurations => [‘Development-release’, ‘Development-debug’]
Sentinel – a library for configuring a single entry point for every debug tool being used
Sentinel is a library created with simplicity in mind. It allows developers to configure a single entry point for every debug tool being used. This library’s primary goal is to give developers the ability to configure the screen with multiple debug tools that will become available on some event (e.g., screen shake, notification, etc.).
The library is available for both Swift and Objective-C.
Configuration & Use
Sentinel is the main class used to set up the Sentinel that will be used in the application. The Sentinel object can be configured with the setup method by the Configuration object.
The Configuration object contains multiple objects that define general Sentinel behavior. All the inputs this object needs for initialization are trigger, sourceScreenProvider, and tools.
The self-explanatory trigger object is a type of Trigger that defines the event that will trigger the Sentinel. This will result in presenting the Sentinel to the developer. At the time of writing this article, three trigger types are supported by default – ShakeTrigger, ScreenshotTrigger, NotificationTrigger. Bear in mind that new triggers can be added as well, they just need to conform to the Trigger protocol.
SourceScreenProvider is a type that provides the view controller from which Sentinel is presented. For now only one (default) type is supported.
The array of Tool objects is the last one required for final Sentinel configuration. This type of object represents the tools which will be available for use in Sentinel. Multiple tools are already supported by the library, but you can also create custom ones.
To create custom tools, create a new class that conforms to the Tool protocol defined below.
public protocol Tool {
    var name: String { get }
    func presentPreview(from viewController: UIViewController)
}
Based on the code above, you need to provide a name and a presentPreview method, which is used for presenting the tool view controller from the sourceScreenProvider view controller defined in the Sentinel configuration.
Adding Sentinel to your project is done by defining Sentinel.Configuration and calling the setup method inside the AppDelegate‘s well known application(_:didFinishLaunchingWithOptions:) method. All that said, creating a Sentinel that triggers all the debug tools to display on device shake would look like the code below.
let configuration = Sentinel.Configuration(
    sourceScreenProvider: SourceScreenProviders.default,
    trigger: Triggers.shake,
    tools: [
        GeneralInfoTool(),
        UserDefaultsTool(),
        LoggieTool(),
    ]
)

Sentinel.shared.setup(with: configuration)
Push your app development forward
To conclude, both Sentinel and Collar are very useful libraries. The former is a library that helps you save time by organizing all your debug tools into one place, and the latter allows you to observe the flow of analytics data visually.