The whole purpose of website optimization is to make your site as performant to search engines and people as possible. The first step to achieving that goal is to identify issues - that’s the foundation of any great optimization process. You can find many tools in the market specialized just for that. Because so many available options exist, we covered the most used and reliable ones. Before diving deep into testing, let's cover metrics and their definitions which are important:
First visit - the time it takes for the page to load when there are no resources in the browser cache
Repeat visit - the time it takes for the page to load when there are some resources present in the browser cache
Load Time - the time it takes for the page to be completely downloaded, rendered, and then displayed to the user
Time to First Byte (TTFB) - the time it takes from the start of the request to when the browser receives the first byte of the response from the server (best if 600ms or less)
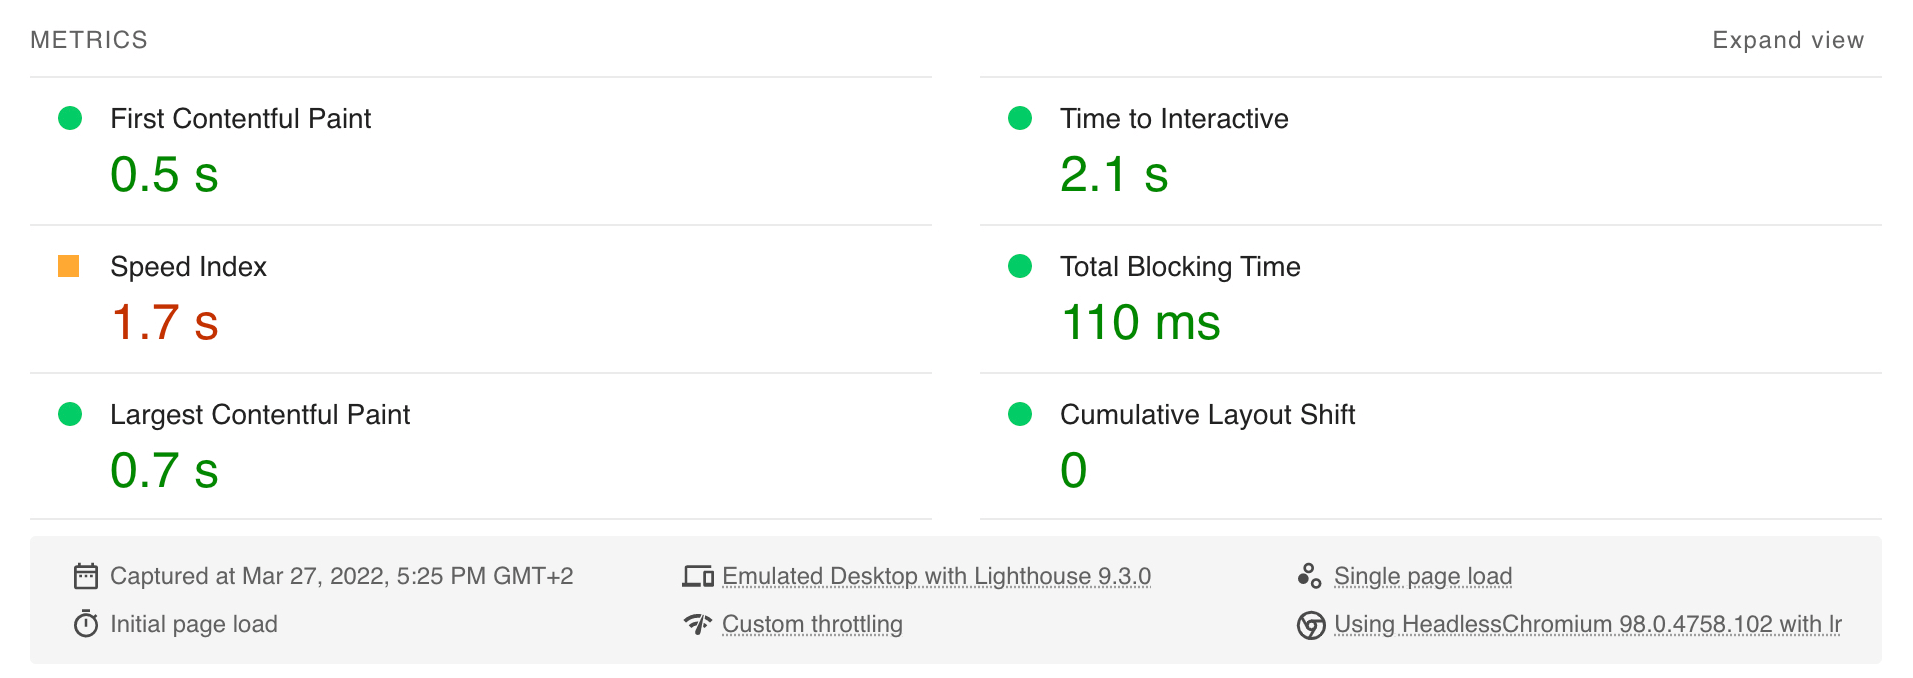
First Contentful Paint (FCP) - the time it takes for the browser to display the page content (best if 0.9s or less)
Time to Interactive (TTI) - the time it takes for the page to become fully interactive (best if 2.5s or less)
Speed Index - how quickly the contents of the page are visibly populated, depends on the browser viewport size (best if 1.3s or less)
Total Blocking Time (TBT) - the time the page was blocked from interaction during the loading process (best if 150ms or less)
Largest Contentful Paint (LCP) - the time for the largest content element to be displayed on the page (best if 1.2s or less)
Cumulative Layout Shift (CLS) - an amount of layout shifting as page loads (best if 0.1 or less)
These are factors almost all tools provide in reports. For ideal performance, the recommended score of each metric should be targeted.
Lighthouse
Lighthouse is an open-source tool for testing web pages with audits for performance, accessibility, progressive web apps, SEO, and more. It can be run from your browser's DevTools (in Chrome and Edge, and probably other Chromium browsers), command line, node package, or WebUI.
Scores: - 0-49: poor - 50-89: needs improvement - 90-100: good
PageSpeed Insights
PageSpeed Insights reports on the performance of a page on both mobile and desktop devices and provides suggestions on how it can be improved. The given score, based on a Lighthouse run, summarizes the page's simulated performance.
GTmetrix
GTmetrix is a website speed and analytics tool. It generates a score from F to A. The free version provides basic information, but by creating an account or buying the premium version you get much more detailed reports and some very useful features.
How to test properly?
Each website test tool offers different functionalities and features, so it can be a bit difficult to come up with a strategy that will produce quality results to act upon. That raises the question: What is the right approach for testing?
Proper testing should include several things: - testing from different locations - testing with and without cache - testing on multiple devices
Testing from different locations
It is expected that visitors from all over the world will land on the website. Testing from multiple locations can give a good idea of the actual performance seen by the user. In most cases, a majority of visitors could end up being grouped in several specific geographic regions. This can vary depending on brand reputation, but such data can provide good insights for future location targeting.
Testing against multiple global locations and endpoints can give a better feeling of how web server speed compares against different regions, and where specific performance issues lie.
Testing with and without cache
The cache needs to be filled before it can be used. When the visitor enters a site for the first time, several requests are made to the server to fetch the required assets and information to display on the webpage. This means that caching is a performance enhancement, not the ultimate solution for performance.
Since the cache is not helpful for the initial visit, it is important to test website speed without it to know the true performance. The cache can be prone to produce false performance scores that can lead to a bad user experience. Bypassing it while testing can reveal the true underlying performance issues.
When caching is turned off and you can track some real user performance metrics it's time to start implementing real improvements to the whole website.
Testing on multiple devices
In real-life situations, visitors are coming to the website on any number of devices and browsers. As there is an overwhelming combination of screen sizes, devices, operating systems and browsers to choose from, and tools are usually putting limits to test time and resources, it is important to start by establishing the intended range of configurations that need to be supported. We can’t test them all, so we need to make sure to test as many variations as possible to cover the largest pool of users.
For a good reference point, GlobalStats gives up-to-date statistics on market share for operating systems, browser usage, and even what screen size is being used to view pages. Additionally, if the client can provide their own usage analytics, the specifications can be narrowed down even further.
Advanced options like selecting different mobile devices (iPhone, Samsung, Google Pixel, etc.), mobile browsers (Chrome, Firefox, Safari, etc.), along with bandwidth throttling options (2G/3G/4G) are usually additional features that require creating an account or paying subscription.
How to read data?
Running tests is fairly simple. Entering URL is usually all that needs to be done. After a few seconds of analyzing, results can be read, sometimes saved, or downloaded.
PageSpeed Insights returns a few metrics marked as critical or vital. If you know what they represent, you can pull enough conclusions from them to plan your next move.
For example, if Time to Interactive is the amount of time it takes for the page to become fully interactive. This allows us to visualize in phase of the page loading process this occurs and what it means for the end-user.
Another example is Largest Contentful Paint - the time at which the largest text or image element is displayed ("painted"). This metric could indicate a bottleneck or something that requires extra attention (if results aren't satisfying, of course).
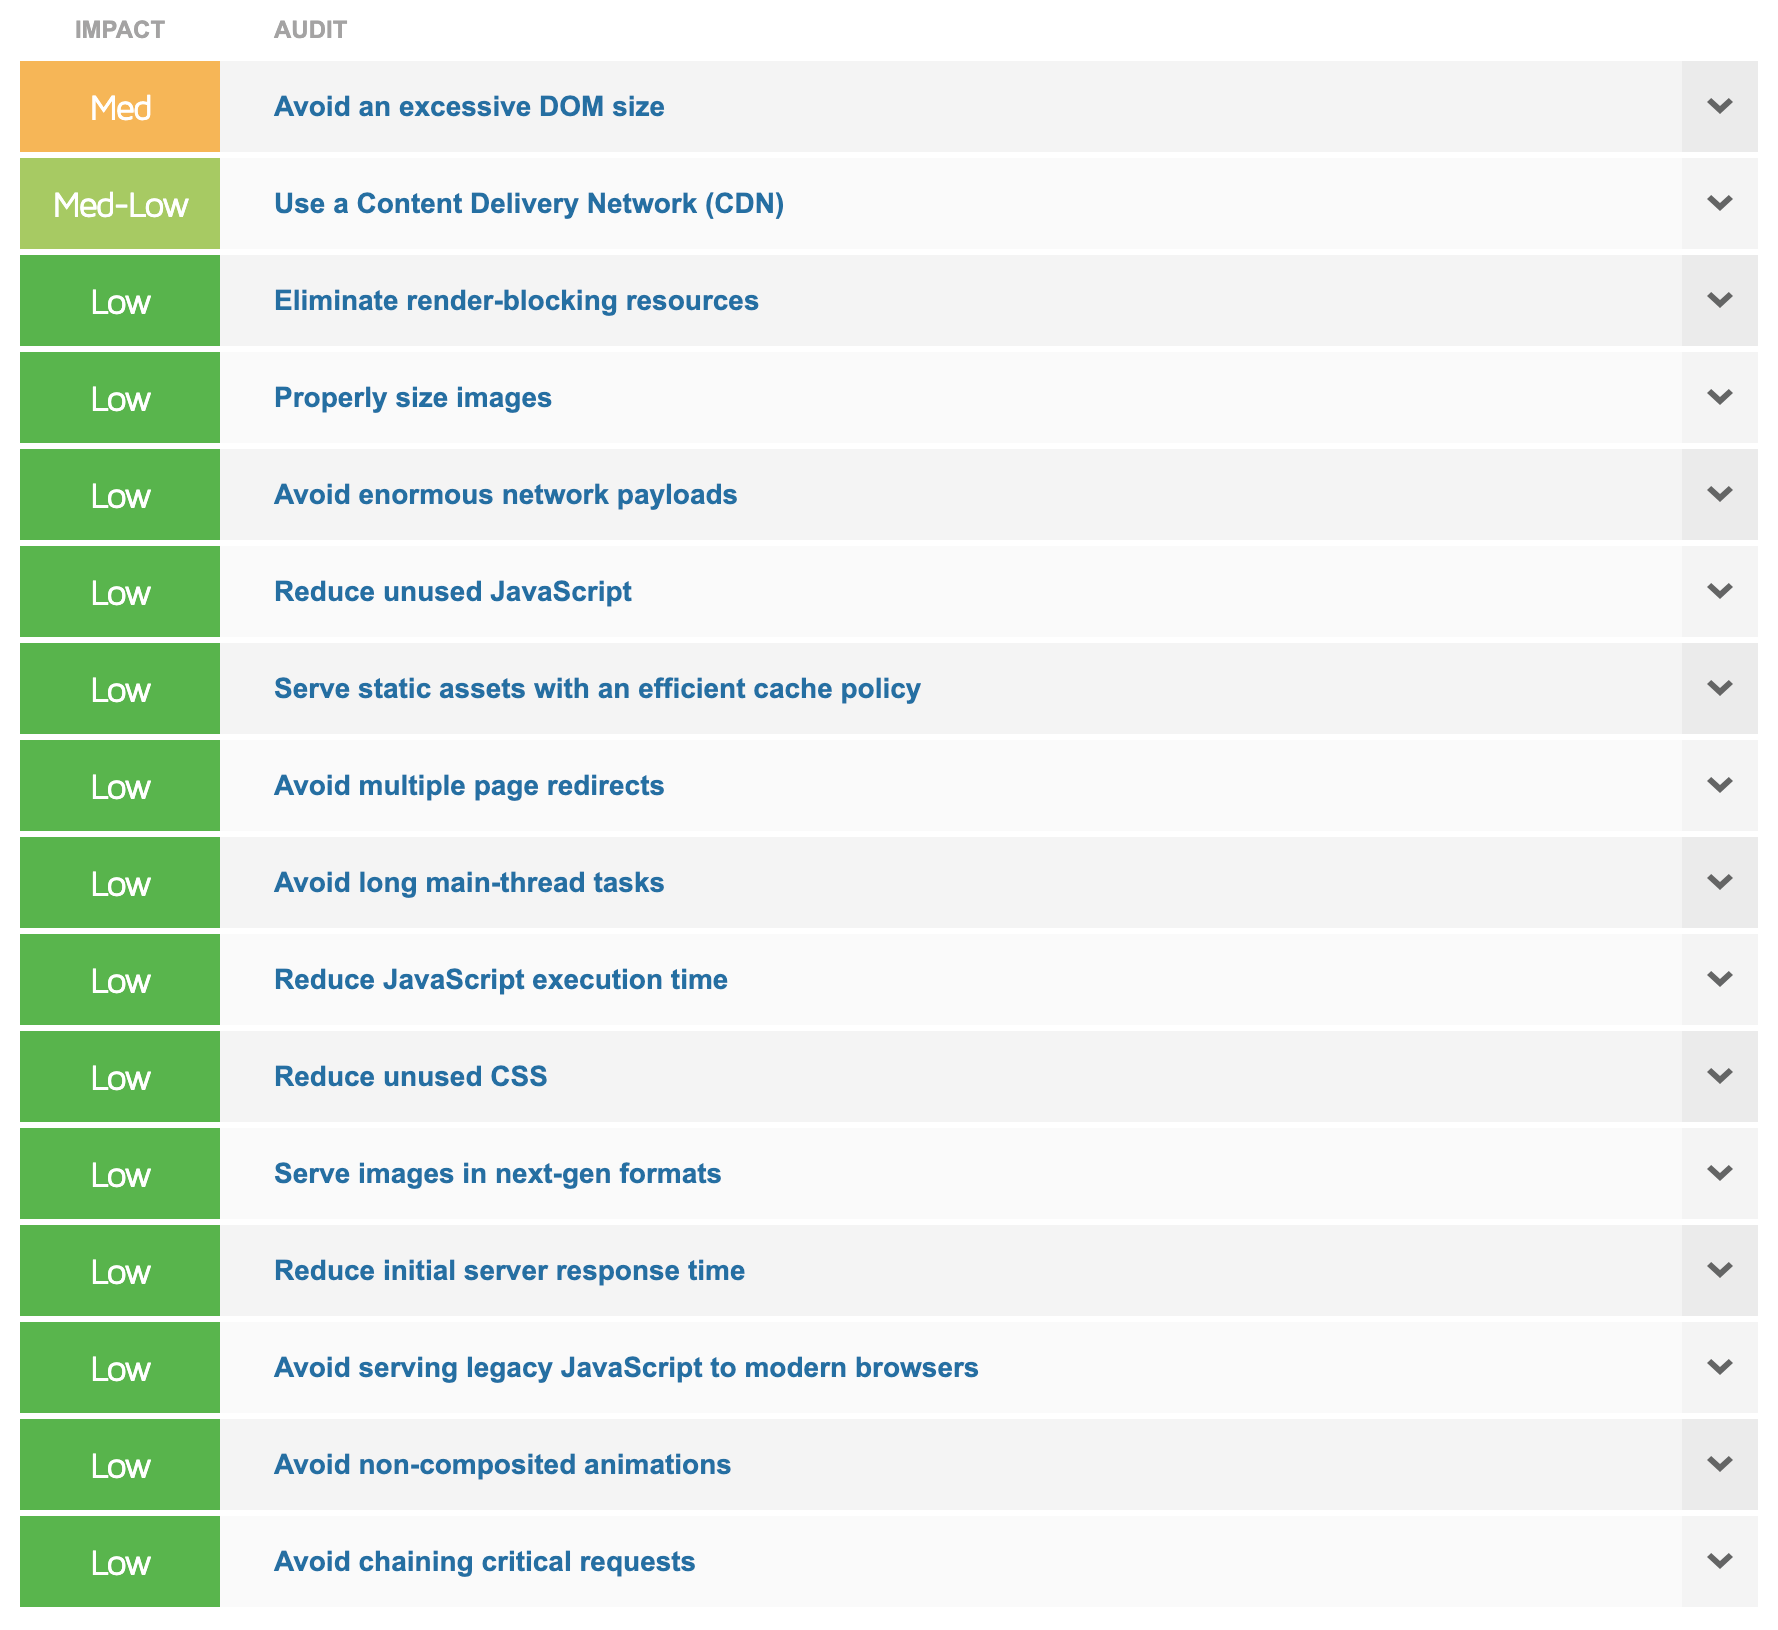
GTmetrix provides a much more detailed report than PageSpeed Insights. All data is organized in report tabs. Under the structure tab, all issues are displayed ordered by priority, from high to low. More information about each item can be seen by clicking on it.
In this case, there are not many critical areas. Just an excessive DOM size warning and a recommendation for using a CDN. All other issues don't have too much impact on overall performance, but they still could be points of improvement. When items are expanded, GTmetrix gives a nice explanation for the issue along with technical details, so everything is on track and easy to understand.
Mobile vs. desktop
When running a speed test for a mobile device and a desktop device, you could notice quite the difference in performance results. This can happen for several reasons. Mobile device users are going to be greatly impacted by their connection speed (3G/4G/5G, Wi-Fi, etc.). Another reason can be how the page styles are loaded. Mobile devices render CSS differently compared to desktop devices, such as resizing images and considerations around viewport/screen sizes. Not to forget, mobile devices often are not as powerful as desktop computers.
It’s recommended to use a test tool that can run tests on various mobile devices, as such tests will provide more real-world results.
Can we trust the results?
Be prepared to get slightly different results for multiple tests. Various things can cause this: internet routing changes, browser extensions, different ads being served, web server variable load, available client resources, etc.
Don't let this concern you if the results are all within a margin of error. If there are bigger discrepancies, check the tools you're using - there might be a wrong configuration setting applied.