Xdebug is an indispensible tool when working on PHP projects. It's a very powerful debugger which can be used for code coverage when running tests as well.
If you have Laravel Herd Pro installed, Xdebug is already installed and configured for you. If you don't have Laravel Herd Pro, you can install Xdebug manually with a little bit of effort.
Visual Studio Code
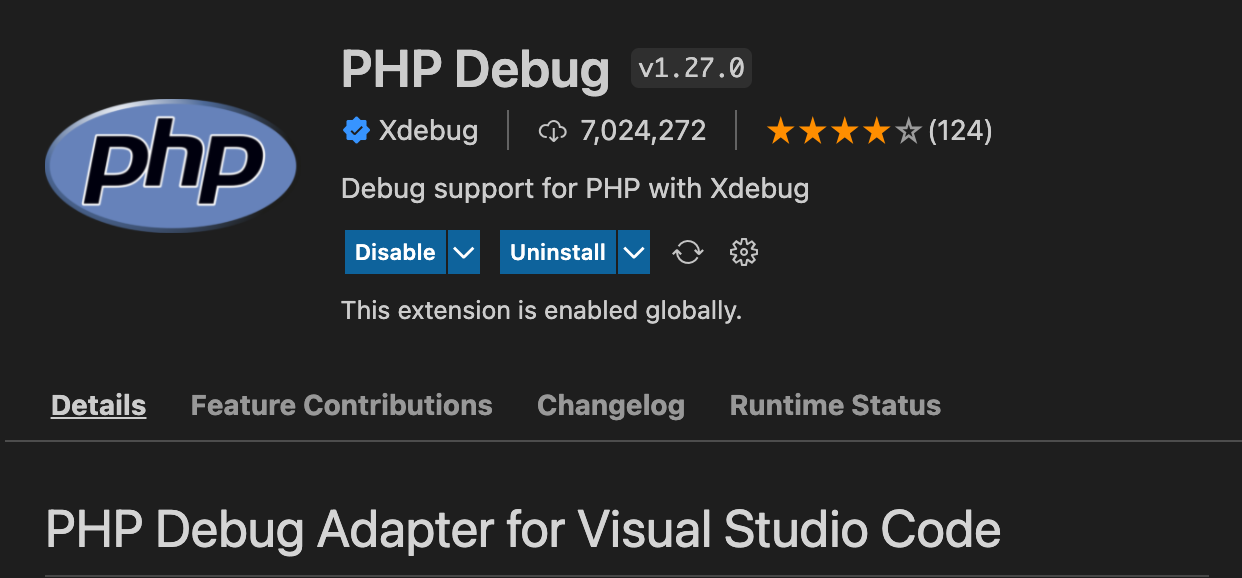
Install the PHP Debug extension published by Xdebug. The PHP Debug extension can also be found in VSCode's Extensions tab by searching for it.
Once installed click on the Run tab and select "Add configuration...". Now, you'll need to pick the PHP environment. A new launch.json file will be added to the root directory by VSCode. By default it will contain 3 configurations. The one you need is the "Listen for Xdebug".
Example of the "Listen for Xdebug" configuration:
{
    "name": "Listen for Xdebug",
    "type": "php",
    "request": "launch",
    "port": 9003
}
Start debugging by opening the debug mode tab. In the dropdown select "Listen for Xdebug" and click the green debug button next to the dropdown.
If the process started successfully you will now see several options in the window, via which you can pick what logs Xdebugger will show like:
- Notices
- Warnings
- Errors
- Exceptions
- Everything
And you will see a small floating bar where you can Pause/Stop the debugger or step trough the steps when debugging breakpoints.
While the debugger is running you can run unit tests or run your website (chrome php debug extension needed) and debugger will listen for anything you selected and show you the data in the VS Code debug view.
Using Xdebug in Postman
There are some instances where you'd like to debug the logic for your API calls.
In this case you'll need to add a query parameter to your endpoint URL:
https://yoururl.test/wp-json/wp/v2/posts?XDEBUG_SESSION_START=PHPSTORM
The query parameter value can be changed according to your IDE.
PhpStorm
If you are using PhpStorm, setting up Xdebug is straightforward.
For webserver script debugging (e.g. integration test debugging), you can add the URL to your server setup, and correct port mappings in the server settings, and it should work.
In the case of running script debugging that isn't tied to a specific domain (for instance you want to debug a phpcs sniff), the server name can be localhost, but it's important to correctly set up path mappings. For instance in the image below
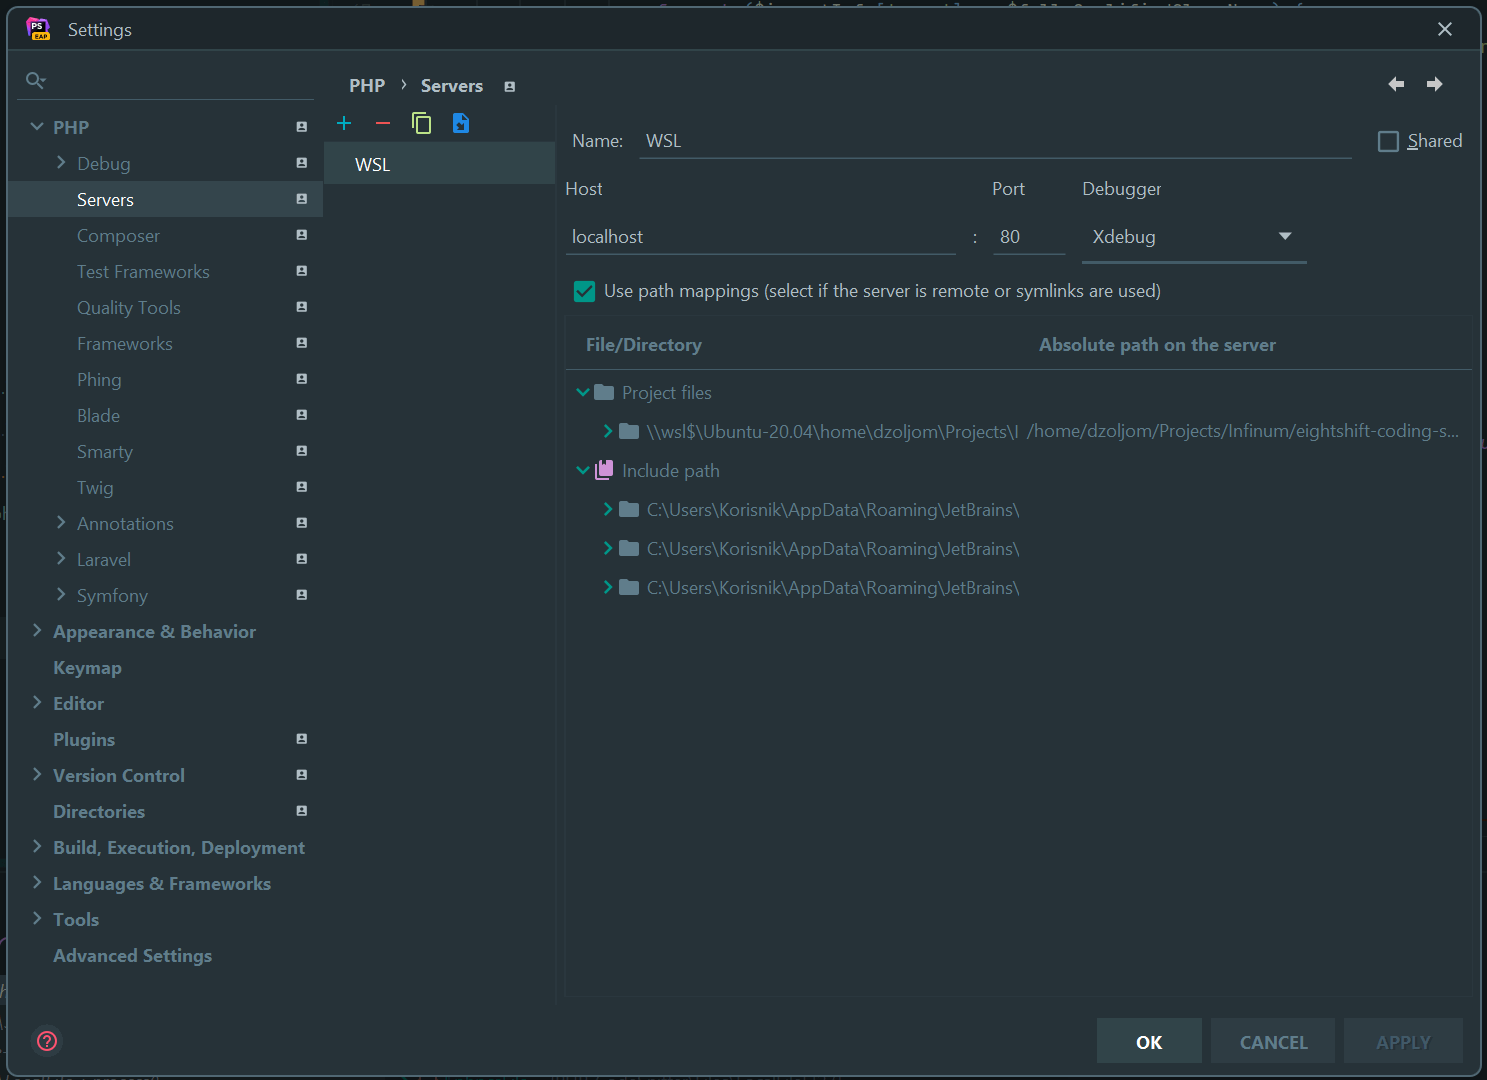
The name of the server is WSL, host is localhost, but the port mappings between the local files and server files are specified (note that the local ones have \\wsl$ prefix, while the server ones are the ones you get by typing pwd inside your terminal, like /home/...).
Then running the script as
XDEBUG_TRIGGER=yes PHP_IDE_CONFIG=serverName=WSL CLI SCRIPT
will correctly trigger a breakpoint and you can debug your script as before.
That is because from the PhpStorm's point of view, the WSL distribution is a server, so it needs to have the correct port mappings available so that it can connect the dots.
Debugging CLI scripts
When you want to debug the CLI scripts, such as automated tests or custom commands, you need to add a manual trigger:
XDEBUG_TRIGGER=yes CLI SCRIPT
This will instruct Xdebug to be triggered on the script run.
WSL2 issues
Windows Subsystem for Linux (WSL) works differently than MacOS system, because you need to set the correct external IP address for Xdebug to be able to 'listen' to the requests.
To quickly find the external IP of your WSL you can type
ip route show default | awk '{print }'
in your WSL terminal. Then you need to add this IP address as your xdebug.client_host in your php.ini or xdebug.ini settings.
After that make sure you restart your PHP server. You should be able to use XDebug normally.
In order to debug the CLI scripts, you'll need to add additional environment variable
XDEBUG_TRIGGER=yes PHP_IDE_CONFIG=serverName=yourprojectname.test CLI SCRIPT