As our Swift projects were getting bigger, we noticed that the compile time was way above what one would call acceptable. We're talking ~25 min for a clean build.
After some analysis, we realized that there are two major groups of problems—one was Cocoapods and the other was Swift syntax.
Below, you can find some issues and how to resolve them. Also, this isn't a silver bullet, so the best way is to do it gradually and measure intermediate states.
Common issues
Complex expressions, for example:
Bad
let x = ["A", nil, "B", nil, "C"].flatMap{$0}.reduce("", +)
Good
let x: String = ["A", nil, "B", nil,"C"]
    .flatMap { letter -> String? in
        return letter
    }
    .reduce("") { (accumulator, nextItem) -> String in
        return accumulator + nextItem
    }
Concatenation of strings:
Bad
let greeting1 = "Hello, \(firstName) \(lastName)!"
let greeting2 = "Hello, " + firstName + " " + lastName + "!"
Good
let greeting = String(format: "Hello, %@ %@!", firstName, lastName)
Literal array build
Bad
let x = [
    CellItem(name: "A", count: 23, selected: false, actionHandler: {}),
    CellItem(name: "B", count: 12, selected: true, actionHandler: {}),
    CellItem(name: "C", count: 15, selected: true, actionHandler: {}),
    CellItem(name: "D", count: 44, selected: false, actionHandler: {}),
]
Good
var x = [CellItem]()
x.append(CellItem(name: "A", count: 23, selected: false, actionHandler: {}))
x.append(CellItem(name: "B", count: 12, selected: true, actionHandler: {}))
x.append(CellItem(name: "C", count: 15, selected: true, actionHandler: {}))
x.append(CellItem(name: "D", count: 44, selected: false, actionHandler: {}))
The above-mentioned problems may or may not affect your build time. The only way to be sure of this is to actually measure how long does it take for each method call to compile. If you wonder how to do it, scroll to the bottom. ;)
Cocoapods
- Every time you do Clean and Build, all of your pods will be recompiled.
- That takes a lot of time—almost 17 minutes in our case!
- To alleviate this, here is a small trick. Put this inside of your pod file as a post-installation hook:
post_install do |installer|
  puts "********** PODS POST INSTALLATION HOOK **********"
  puts "Updating **BUILD SETTINGS** key **DEBUG_INFORMATION_FORMAT** for **ALL PODS** to allow faster build time by changing **DWARF with dSYM** to **DWARF** when in **DEBUG** ... "
  installer.pods_project.targets.each do |target|
      target.build_configurations.each do |config|
      if config.name =~ /Debug/
          # This adds the flag to the Pods.xcodeproj itself at the most local level (basically per **Pod**)
          config.build_settings['DEBUG_INFORMATION_FORMAT'] = 'dwarf';
      end
    end
  end
end
- This will go through all of your Pod targets and Build Settings, and it will change
DWARF with dSYMto onlyDWARFunder Debug Information. This is perfectly fine when in DEBUG for 99% of the time. - dSYM are the symbols you need to symbolicate crash logs (so that you can get method names, etc.).
Global project compile time
- If you want to see how long it takes for the whole project to build, just copy/paste this to the console and restart Xcode:
$ defaults write com.apple.dt.Xcode ShowBuildOperationDuration YES
Compile time per method call
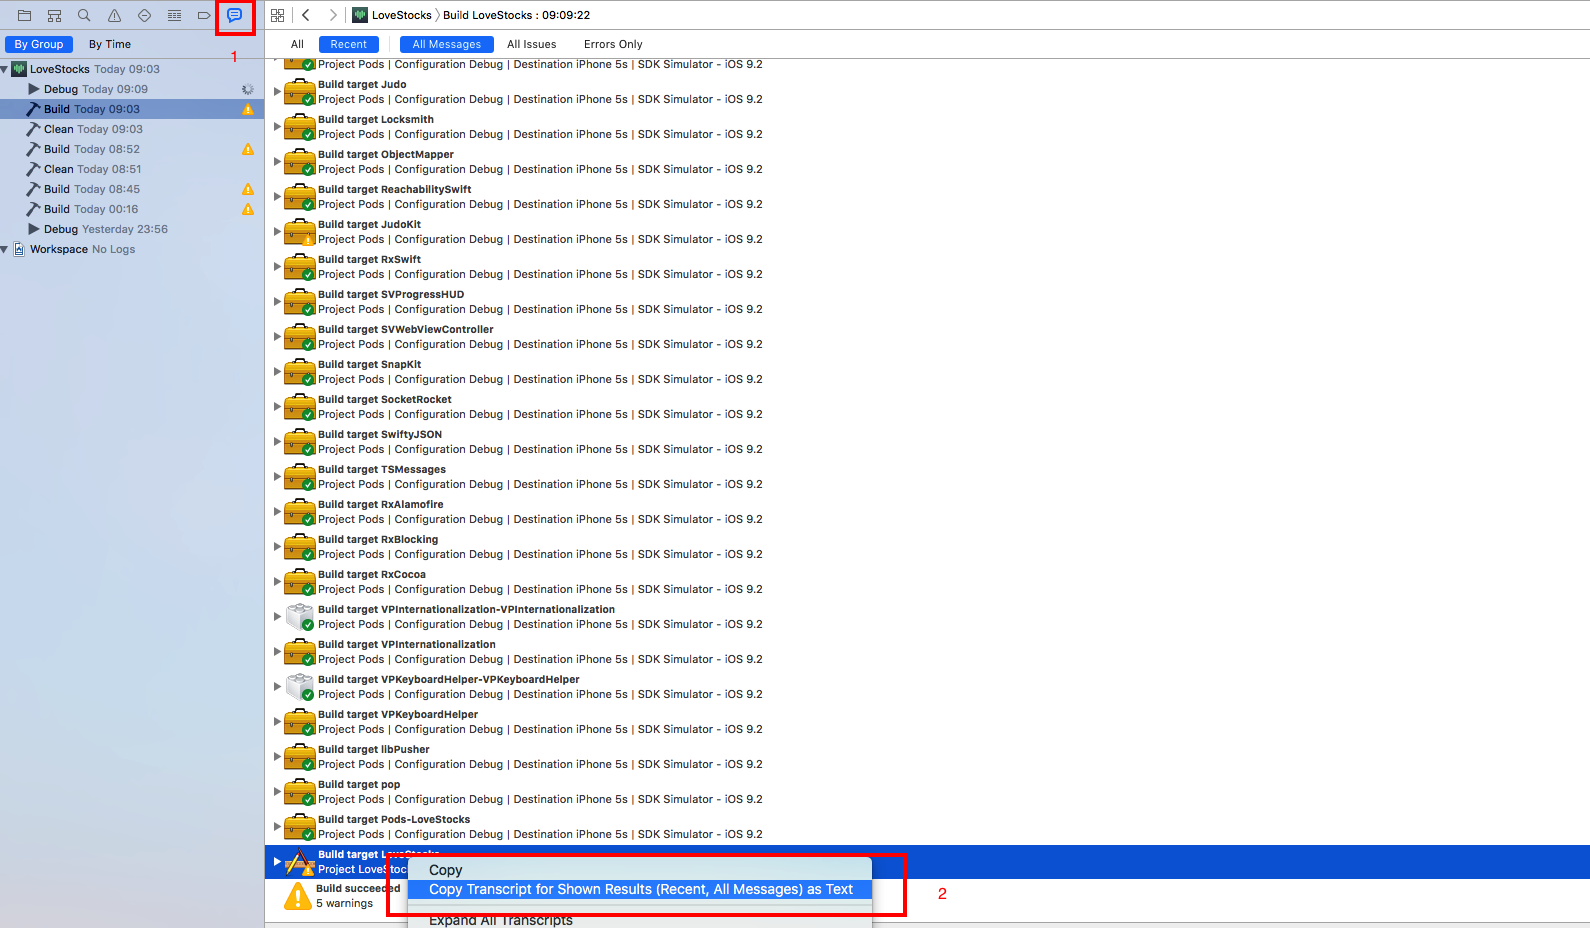
- Go to Build Settings and add -Xfrontend -debug-time-function-bodies to Swift flags key
- Clean and build your project
- Follow the screenshot:

- Open a text editor and paste the copied log; save to ~/Desktop
- Wait a bit because it can be well over 100MB
- Copy Ruby script iOS compile time review to ~/Desktop
- Run script in terminal
$ ruby compile_time_review.rb YOUR_FILE_NAME > out.txt - Open out.txt and look at the results
- Fix da shit, clean the build, and run again to see if it has improved.